
Mathematics, 17.06.2020 04:57 jamarian101
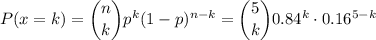
Eighty four percent of adults want to live to age 100. You randomly select five adults and ask them whether they want to live to age 100. The random variable represents the number of adults who want to live to age 100.
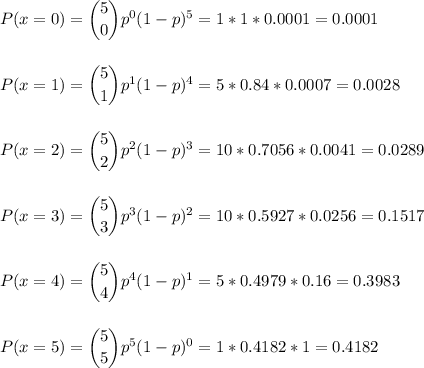
1) Construct a binomial distribution.
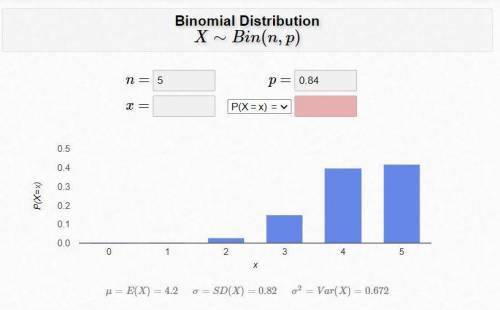
2) Graph the binomial distribution using a histogram and describe its shape. Graph the binomial distribution.
3) What is the shape of the histogram?
A. Symmetric
B. Skewed left
C. Skewed right
4) What values of the random variablex would you consider unusual?
The value(s)would be unusual because the associated probability (probabilities) is(are).

Answers: 3
Another question on Mathematics
Mathematics, 21.06.2019 18:00
If f(x) = 4x – 3 and g(x) = 8x + 2, find each function value a.f[g(3)] b.g[f(5)] c.g{f[g(-4)]}
Answers: 3
Mathematics, 22.06.2019 00:00
David leaves his house to go to school. he walks 200 meters west and 300 meters north. how far is david from his original starting point?
Answers: 1
Mathematics, 22.06.2019 01:00
Tobias gold sells computers at the office center he's guaranteed a minimum salary of $1,959 per month plus 6.3% commission on total sales how much in total sales is he
Answers: 1
You know the right answer?
Eighty four percent of adults want to live to age 100. You randomly select five adults and ask them...
Questions


Mathematics, 24.09.2019 23:00

English, 24.09.2019 23:00
Mathematics, 24.09.2019 23:00

Health, 24.09.2019 23:00


German, 24.09.2019 23:00


