
Mathematics, 18.06.2020 00:57 seasmarie75
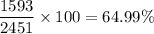
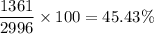
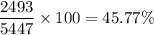
A newspaper conducted a survey to find out how many high school students play video games. The two ways table below displays the data from the survey. Based on these data in the table, which statement is true? A) There were 2,451 boys surveyed, and about 29% of them play video games. B) There were 2,996 girls surveyed, and about 45% of them play video games. C) There were 5,447 students surveyed, and about 54% of them do not play video games. D) There were 2,493 students surveyed, and about 34% of them are girls who do not play veideo games.

Answers: 3
Another question on Mathematics
Mathematics, 21.06.2019 16:00
Part one: measurements 1. measure your own height and arm span (from finger-tip to finger-tip) in inches. you will likely need some from a parent, guardian, or sibling to get accurate measurements. record your measurements on the "data record" document. use the "data record" to you complete part two of this project. name relationship to student x height in inches y arm span in inches archie dad 72 72 ginelle mom 65 66 sarah sister 64 65 meleah sister 66 3/4 67 rachel sister 53 1/2 53 emily auntie 66 1/2 66 hannah myself 66 1/2 69 part two: representation of data with plots 1. using graphing software of your choice, create a scatter plot of your data. predict the line of best fit, and sketch it on your graph. part three: the line of best fit include your scatter plot and the answers to the following questions in your word processing document 1. 1. which variable did you plot on the x-axis, and which variable did you plot on the y-axis? explain why you assigned the variables in that way. 2. write the equation of the line of best fit using the slope-intercept formula $y = mx + b$. show all your work, including the points used to determine the slope and how the equation was determined. 3. what does the slope of the line represent within the context of your graph? what does the y-intercept represent? 5. use the line of best fit to you to describe the data correlation.
Answers: 2
Mathematics, 21.06.2019 17:20
Consider the proof. given: segment ab is parallel to line de. prove: what is the missing statement in step 5?
Answers: 3
Mathematics, 21.06.2019 18:30
The u-drive rent-a-truck company plans to spend $13 million on 320 new vehicles. each commercial van will cost $25 comma 000, each small truck $50 comma 000, and each large truck $80 comma 000. past experience shows that they need twice as many vans as small trucks. how many of each type of vehicle can they buy?
Answers: 1
You know the right answer?
A newspaper conducted a survey to find out how many high school students play video games. The two w...
Questions


Social Studies, 28.01.2020 23:11

Chemistry, 28.01.2020 23:11


Physics, 28.01.2020 23:11
Mathematics, 28.01.2020 23:11
Geography, 28.01.2020 23:11
Mathematics, 28.01.2020 23:11
Mathematics, 28.01.2020 23:11
Social Studies, 28.01.2020 23:11

English, 28.01.2020 23:11
Mathematics, 28.01.2020 23:11

History, 28.01.2020 23:11
Chemistry, 28.01.2020 23:12
Health, 28.01.2020 23:12


