Graded Activity
Status
NOT SUBMITTED
Submit For
Review
Submit For
Sco...

Mathematics, 18.06.2020 03:57 axthomas0475
Graded Activity
Status
NOT SUBMITTED
Submit For
Review
Submit For
Score
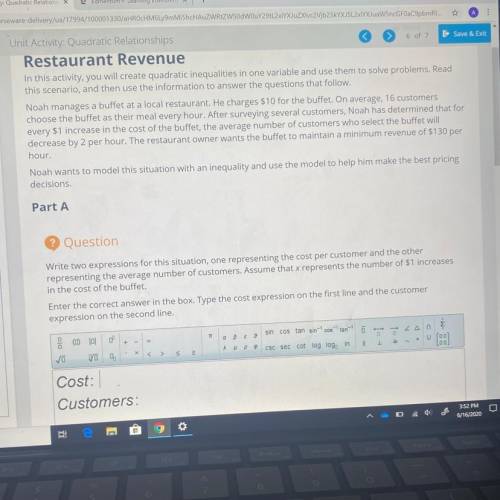
Unit Activity: Quadratic Relationships
6 of 7 E Save & Exit
Restaurant Revenue
In this activity, you will create quadratic inequalities in one variable and use them to solve problems. Read
this scenario, and then use the information to answer the questions that follow.
Noah manages a buffet at a local restaurant. He charges $10 for the buffet. On average, 16 customers
choose the buffet as their meal every hour. After surveying several customers, Noah has determined that for
every $1 increase in the cost of the buffet, the average number of customers who select the buffet will
decrease by 2 per hour. The restaurant owner wants the buffet to maintain a minimum revenue of $130 per
hour.
Noah wants to model this situation with an inequality and use the model to help him make the best pricing
decisions.
Include selected files
Files
Comments
Part A
LA
Question
Write two expressions for this situation, one representing the cost per customer and the other
representing the average number of customers. Assume that x represents the number of $1 increases
in the cost of the buffet.
Enter the correct answer in the box. Type the cost expression on the first line and the customer
expression on the second line.

Answers: 2
Another question on Mathematics
Mathematics, 21.06.2019 14:20
G(x) = 2 sin(2x - π) + 4. using complete sentences, explain how to find the minimum value for the function.
Answers: 3
Mathematics, 21.06.2019 18:00
Ihave trouble finding the nth term of a linear sequence
Answers: 2
Mathematics, 21.06.2019 23:30
Scenario: a rectangular plot of ground is 5 meters longer than it is wide. its area is 20,000 square meters. question: what equation will you find the dimensions? note: let w represent the width. options: w(w+5)=20,000 w^2=20,000+5 (w(w+5))/2=20,000 w+2(w+5)=20,000
Answers: 1
Mathematics, 21.06.2019 23:30
Which graph represents the same relation is the sa which graph represents the same relation as the set {(-3-2)}
Answers: 3
You know the right answer?
Questions
Mathematics, 02.02.2020 19:48

Biology, 02.02.2020 19:48
Mathematics, 02.02.2020 19:48

Physics, 02.02.2020 19:48


Social Studies, 02.02.2020 19:48

Mathematics, 02.02.2020 19:48
Social Studies, 02.02.2020 19:48
Mathematics, 02.02.2020 19:48
English, 02.02.2020 19:48
Mathematics, 02.02.2020 19:48

English, 02.02.2020 19:48


