
Mathematics, 18.06.2020 21:57 jackieanguiano4758
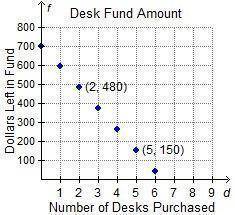
The graph below shows the amount of money left in the school’s desk fund, f, after d desks have been purchased. A graph titled Desk Fund Amount. The horizontal axis shows the number of desks purchased (d), numbered 1 to 9, and the vertical axis shows the dollars left in fund (f) numbered 100 to 800. Blue diamonds appear at points (0, 700), (1, 590), (2, 480), (3, 370), (4, 260), (5, 150), (6, 40). For each new desk that is purchased, by how much does the amount of money left in the school’s desk fund decrease? $110 $135 $165 $190

Answers: 1

Another question on Mathematics
Mathematics, 21.06.2019 20:00
The diagram shows corresponding lengths in two similar figures. find the area of the smaller figure. a. 14.4 yd2 b. 24 yd2 c. 26.4 yd2 d. 28
Answers: 1
Mathematics, 21.06.2019 20:00
If the discriminant if a quadratic equation is 4 which statement describes the roots?
Answers: 3
Mathematics, 21.06.2019 21:30
Ok a point t on a segment with endpoints d(1, 4) and f(7, 1) partitions the segment in a 2: 1 ratio. find t. you must show all work to receive credit.
Answers: 1
Mathematics, 22.06.2019 01:00
Multiply: 2.7 × (–3) × (–1.2). a. –9.72 b. –10.8 c. 10.8 d. 9.72
Answers: 2
You know the right answer?
The graph below shows the amount of money left in the school’s desk fund, f, after d desks have been...
Questions

Mathematics, 30.04.2021 01:00
Mathematics, 30.04.2021 01:00
Mathematics, 30.04.2021 01:00


SAT, 30.04.2021 01:00
Mathematics, 30.04.2021 01:00
Mathematics, 30.04.2021 01:00
Mathematics, 30.04.2021 01:00
Mathematics, 30.04.2021 01:00


