
Mathematics, 17.06.2020 21:57 haydenoo72
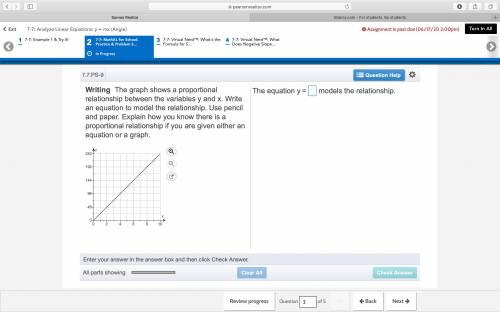
Plz HELP! ASAP: The graph shows a proportional relationship between the variables y and x. Write an equation to model the relationship. Use pencil and paper. Explain how you know there is a proportional relationship if you are given either an equation or a graph.

Answers: 1
Another question on Mathematics
Mathematics, 21.06.2019 15:50
3-12. write each answer with a reasonable number of figures. find the absolute uncertainty and percent relative uncertainty for each answer. (a) [12.41 (±0.09) + 4.16 (±0.01)] x 7.068 2 (±0.000 4) =? (b) [3.26 (±0.10) x 8.47 (±0.05)] - 0.18 (±0.06) =? (c) 6.843 (±0.008) x 104 + [2.09 (±0.04)- 1.63 (±0.01)] =?
Answers: 1
Mathematics, 21.06.2019 17:00
Ifurniture stores having a weekend sale and is offering 20% discount on patio chairs and table the sales tax on furniture is 6.25 using function composition how can you represent the total amount a that you would need to pay for this furniture that cost x dollars
Answers: 1
Mathematics, 21.06.2019 20:00
The distribution of the amount of money spent by students for textbooks in a semester is approximately normal in shape with a mean of $235 and a standard deviation of $20. according to the standard deviation rule, how much did almost all (99.7%) of the students spend on textbooks in a semester?
Answers: 2
Mathematics, 21.06.2019 20:30
Which expression demonstrates the use of the commutative property of addition in the first step of simplifying the expression (-1+i)+(21+5i)+0
Answers: 2
You know the right answer?
Plz HELP! ASAP: The graph shows a proportional relationship between the variables y and x. Write an...
Questions


Biology, 09.10.2021 08:30


Mathematics, 09.10.2021 08:30

Chemistry, 09.10.2021 08:30
Social Studies, 09.10.2021 08:30


