
Mathematics, 19.06.2020 14:57 LilBrookilyn2701
Suppose we have collected times, in minutes, that it takes volunteers to complete a set of pencil and paper mazes. Volunteers are randomly assigned to one of two groups. Group 1 watch a 5 minute video explaining good strategies for completing the mazes. Group 2 watch a 5 minute video of other people successfully completing the mazes, but with no explanation given.
Researchers are interested in testing against the null hypothesis that there is no difference in population mean times that it takes people to complete mazes after watching either type of video.
There are the summary statistics after collecting data. Note that the sample sizes differ, because some subjects did not follow instructions correctly and so they were not included in the analysis.
x1 = 11.98, x2 = 9.15
s1 = 8.69, s2 = 7.75
n1 = 43, n2 = 52
a. Is this an experimental or observational study?
Observational
Experimental
b. What are the predictor and response variables, and are they categorical or quantitative? (You must get all correct)
Video type is categorical
Finishing time is quantitative
Video type is the response variable
Video type is the predictor variable
Video type is quantitative
Finishing time is categorical
Finishing time is the predictor variable
Finishing time is the response variable
How should the null hypothesis be written?
H0: x1 - x2 = 0
H0: μ1 - μ2 = 5
H0: μ = 0
H0: x = 5
H0: x1 - x2 = 5
H0: μ1 - μ2 = 0
(for the following calculations, round to 2 decimal places)
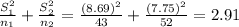
c. Calculate the standard error of x1 - x2:
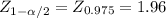
d. Calculate the approximate 95% CI for μ1 - μ2: to
e. The result of the hypothesis test is:
We do not have evidence that there is a difference in population means, because the null value is inside the 95% CI.
We do not have evidence that there is a difference in population means, because the null value is outside the 95% CI.
We have evidence that there is a difference in population means, because the null value is inside the 95% CI.
We have evidence that there is a difference in population means, because the null value is outside the 95% CI.
f. What kind of error is it *possible* that we have made?
1. It is possible that we made a Type I error, because this is when you reject a false null hypothesis.
2. It is possible that we made a Type I error, because this is when you fail to reject a false null hypothesis.
3. It is possible that we made a Type I error, because this is when you reject a true null hypothesis.
4. It is possible that we made a Type I error, because this is when you fail to reject a true null hypothesis.
5. It is possible that we made a Type II error, because this is when you reject a false null hypothesis.
6. It is possible that we made a Type II error, because this is when you fail to reject a false null hypothesis.
7. It is possible that we made a Type II error, because this is when you reject a true null hypothesis.
8. It is possible that we made a Type II error, because this is when you fail to reject a true null hypothesis.

Answers: 1
 *
*
Another question on Mathematics
Mathematics, 22.06.2019 00:30
Jaxon has s packs of 8 crazy straws. he divided the crazy straws into 2 equal bags. now, he has 224 crazy straws in each bag. how many packs of crazy straws did jaxon start with?
Answers: 1
Mathematics, 22.06.2019 01:50
Whats the theoretical probability of popping a polka dot balloon? express your answer as a fraction, decimal and percent solid 15 polka dot 5 striped 17 plzz me due tomorrow
Answers: 2
You know the right answer?
Suppose we have collected times, in minutes, that it takes volunteers to complete a set of pencil an...
Questions


Mathematics, 04.02.2020 01:57

Physics, 04.02.2020 01:57


Chemistry, 04.02.2020 01:57


