Mathematics, 24.06.2020 09:01 clairefc2019
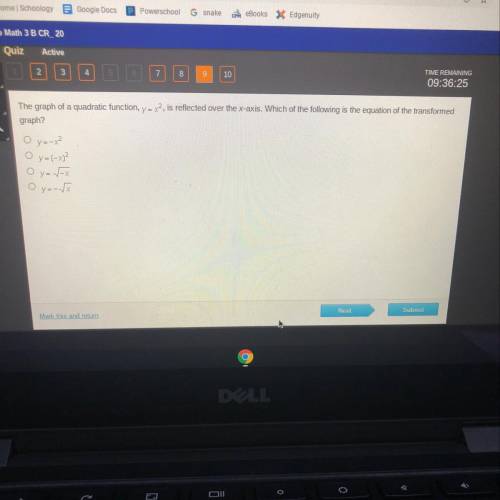
The graph of a quadratic function, y = x?, is reflected over the x-axis. Which of the following is the equation of the transformed
graph?
O y=-x2
O y=(-x)2
Oy= v=x
Oy--


Answers: 3
Another question on Mathematics

Mathematics, 21.06.2019 16:00
Plzzz i beg u so much asaaaap ! what is the slope of this line? enter your answer in the box.
Answers: 1

Mathematics, 21.06.2019 20:00
Write the point-slope form of the line passing through (2, -12) and parallel to y=3x.
Answers: 3

Mathematics, 21.06.2019 21:30
Create a graph for the demand for starfish using the following data table: quantity/price of starfish quantity (x axis) of starfish in dozens price (y axis) of starfish per dozen 0 8 2 6 3 5 5 2 7 1 9 0 is the relationship between the price of starfish and the quantity demanded inverse or direct? why? how many dozens of starfish are demanded at a price of five? calculate the slope of the line between the prices of 6 (quantity of 2) and 1 (quantity of 7) per dozen. describe the line when there is a direct relationship between price and quantity.
Answers: 3

Mathematics, 21.06.2019 21:30
Name and describe the three most important measures of central tendency. choose the correct answer below. a. the mean, sample size, and mode are the most important measures of central tendency. the mean of a data set is the sum of the observations divided by the middle value in its ordered list. the sample size of a data set is the number of observations. the mode of a data set is its highest value in its ordered list. b. the sample size, median, and mode are the most important measures of central tendency. the sample size of a data set is the difference between the highest value and lowest value in its ordered list. the median of a data set is its most frequently occurring value. the mode of a data set is sum of the observations divided by the number of observations. c. the mean, median, and mode are the most important measures of central tendency. the mean of a data set is the product of the observations divided by the number of observations. the median of a data set is the lowest value in its ordered list. the mode of a data set is its least frequently occurring value. d. the mean, median, and mode are the most important measures of central tendency. the mean of a data set is its arithmetic average. the median of a data set is the middle value in its ordered list. the mode of a data set is its most frequently occurring value.
Answers: 3
You know the right answer?
The graph of a quadratic function, y = x?, is reflected over the x-axis. Which of the following is t...
Questions

Chemistry, 23.10.2019 05:20


Physics, 23.10.2019 05:20

Biology, 23.10.2019 05:20


Biology, 23.10.2019 05:20

Business, 23.10.2019 05:20

SAT, 23.10.2019 05:20


Mathematics, 23.10.2019 05:20


Biology, 23.10.2019 05:20


Mathematics, 23.10.2019 05:20


History, 23.10.2019 05:20

English, 23.10.2019 05:20


