
Mathematics, 27.06.2020 07:01 PoPFli21
HELP
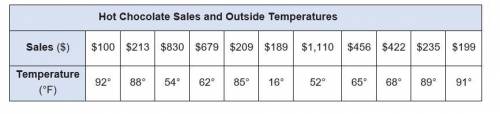
Step 1: Constructing and analyzing scatterplots You keep track of the daily hot chocolate sales and the outside temperature each day. The data you gathered is shown in the data table below. Hot Chocolate Sales and Outside Temperatures Sales ($) $100 $213 $830 $679 $209 $189 $1,110 $456 $422 $235 $199 Temperature (°F) 92° 88° 54° 62° 85° 16° 52° 65° 68° 89° 91° a)
Make a scatterplot of the data above. (2 points) b) Do you notice clusters or outliers in the data?
Explain your reasoning. (2 points) c) How would you describe the correlation in the data?
Explain your reasoning. (2 points)
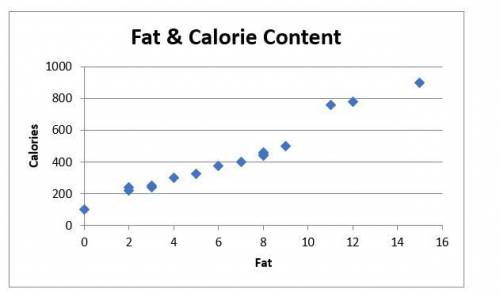
d) What are the independent and dependent variables? (2 points) Step 2: Evaluating trends of data Because you want to prepare and serve the healthiest food possible, you monitor the fat and calorie content of items on your menu. Some of the menu items are included in the graph below.
a) Your business partner describes this as a high positive correlation. Is your partner correct? Why or why not? (2 points)
b) Using the drawing tools, draw a trend line (line of best fit) on the graph above. (2 points)
c) Judge the closeness of your trend line to the data points. Do you notice a relationship between the data points? (2 points)
d) Is the trend line linear? If so, write a linear equation that represents the trend line. Show your work. (3 points)
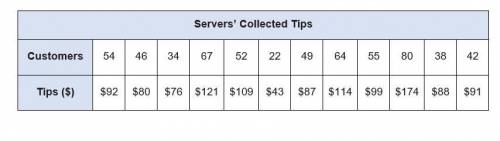
Step 3: Making predictions using data You and your business partner track the number of customers served and the amount of tips collected per day. The data you gathered is displayed in the chart below. Servers’ Collected Tips Customers 54 46 34 67 52 22 49 64 55 80 38 42 Tips ($) $92 $80 $76 $121 $109 $43 $87 $114 $99 $174 $88 $91 a) Create a scatterplot displaying the data in the table. Be sure to include a linear trend line. (2 points)
b) Find the equation of the trend line (line of best fit). Show your work. (2 points)
c) Predict the amount of tips that would be collected if 100 customers were served at the restaurant on a given day. Explain your reasoning. d) Explain how to use the regression calculator to make a reasonable prediction given a data table.

Answers: 1
Another question on Mathematics
Mathematics, 21.06.2019 12:30
‼️‼️‼️‼️‼️‼️‼️‼️‼️‼️‼️‼️‼️‼️‼️‼️‼️‼️‼️‼️‼️‼️ i have been waiting for almost an hour with no ! only answer if you absolutely know the ! explain your answer and ensure that it is you so so much!
Answers: 1
Mathematics, 21.06.2019 16:20
Abank gives 6.5% interest per year. what is the growth factor b in this situation?
Answers: 3
Mathematics, 21.06.2019 17:00
If the wwight of a package is multiplied by 7/10 the result is 65.8 find the weight of the package
Answers: 1
Mathematics, 21.06.2019 17:00
Write an algebraic expression for the word expression the quotient of c and 8
Answers: 1
You know the right answer?
HELP
Step 1: Constructing and analyzing scatterplots You keep track of the daily hot chocolate sale...
Questions

Social Studies, 04.01.2021 18:30

Mathematics, 04.01.2021 18:30
Mathematics, 04.01.2021 18:30
Mathematics, 04.01.2021 18:30


World Languages, 04.01.2021 18:30

Arts, 04.01.2021 18:30
Mathematics, 04.01.2021 18:40

History, 04.01.2021 18:40
Mathematics, 04.01.2021 18:40
Mathematics, 04.01.2021 18:40

Mathematics, 04.01.2021 18:40
Mathematics, 04.01.2021 18:40
Mathematics, 04.01.2021 18:40
Mathematics, 04.01.2021 18:40


