
Mathematics, 01.07.2020 15:01 shaffergabe10
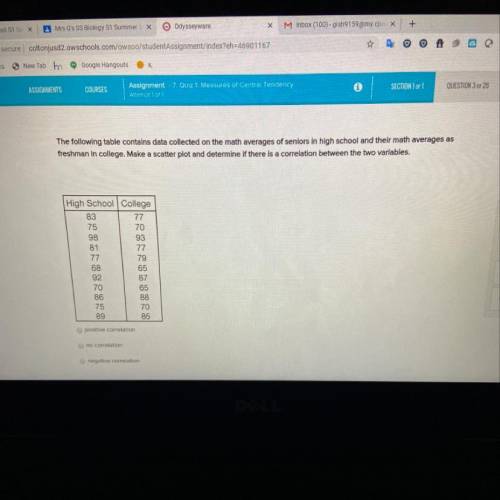
The following table contains data collected on the math averages of seniors in high school and their math averages as
freshman in college. Make a scatter plot and determine if there is a correlation between the two variables.
High School College
83
77
75
70
98
93
81
77
77
79
68
65
92
87
70
65
86
88
75
70
89
85
positive correlation
no correlation
negative correlation

Answers: 2
Another question on Mathematics
Mathematics, 21.06.2019 22:00
How do you write a paragraph proof to prove that the corresponding angles shown are congruent
Answers: 2
Mathematics, 21.06.2019 23:20
Identify the function that contains the data in the following table: x -2 0 2 3 5 f(x) 5 3 1 2 4 possible answers: f(x) = |x| + 1 f(x) = |x - 2| f(x) = |x - 2| - 1 f(x) = |x - 2| + 1
Answers: 1
Mathematics, 21.06.2019 23:30
The product of sin 30 degrees and sin 60 degrees is same as the product of
Answers: 1
You know the right answer?
The following table contains data collected on the math averages of seniors in high school and their...
Questions

Spanish, 22.10.2021 03:10

SAT, 22.10.2021 03:20

Social Studies, 22.10.2021 03:20
English, 22.10.2021 03:30
Mathematics, 22.10.2021 03:30

Geography, 22.10.2021 03:40
Mathematics, 22.10.2021 03:40

World Languages, 22.10.2021 03:50
Mathematics, 22.10.2021 04:00
Social Studies, 22.10.2021 04:00
Mathematics, 22.10.2021 04:00
Mathematics, 22.10.2021 04:00
Social Studies, 22.10.2021 04:10


