
Mathematics, 30.06.2020 02:01 Bhoom7232
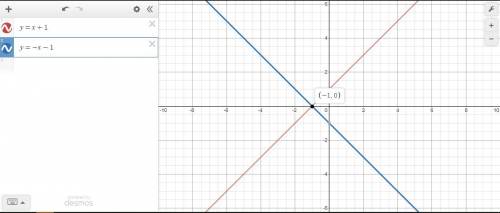
(08.02)Which of the following graphs best represents the solution to the pair of equations below? y = x + 1 y = −x − 1 A coordinate plane is shown with two lines graphed. One line passes through the y axis at 1 and the x axis at 1. The other line passes through the y axis at 1 and the x axis at negative 1. The lines intersect at 0 comma 1. A coordinate plane is shown with two lines graphed. One line passes through the y axis at 1 and the x axis at negative 1. The other line passes through the y axis at negative 1 and the x axis at negative 1. The lies intersect at negative 1 and 0. A coordinate plane is shown with two lines graphed. One line passes through the y axis at negative 1 and the x axis at negative 1. The other line passes through the y axis at negative 1 and the x axis at 1. The lines intersect at 0 comma negative 1. A coordinate plane is shown with two lines graphed. One line passes through the y axis at negative 1 and the x axis at 1. The other line passes through the y axis at 1 and the x axis at 1. The lines intersect at 1 comma 0.

Answers: 1
Another question on Mathematics
Mathematics, 21.06.2019 18:00
Look at arnold's attempt to solve the equation for b: 3b = 12 b = 3 · 12 b = 36 describe the mistake that arnold made.
Answers: 2
Mathematics, 21.06.2019 20:00
Given ab and cb are tangents of p, and m =10°. what is the measure of abp?
Answers: 1
Mathematics, 22.06.2019 01:00
Ineed to know how to write question one in mathematical terms
Answers: 1
Mathematics, 22.06.2019 02:00
What is the area of this parallelogram? 434.28 cm2 263.67 cm2 527.34 cm2 217.14 cm2
Answers: 1
You know the right answer?
(08.02)Which of the following graphs best represents the solution to the pair of equations below? y...
Questions


Biology, 11.07.2019 03:30
Mathematics, 11.07.2019 03:30

English, 11.07.2019 03:30

Biology, 11.07.2019 03:30
Mathematics, 11.07.2019 03:30
Mathematics, 11.07.2019 03:30


