
Mathematics, 04.07.2020 21:01 kprincess16r
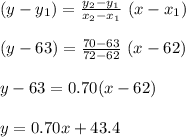
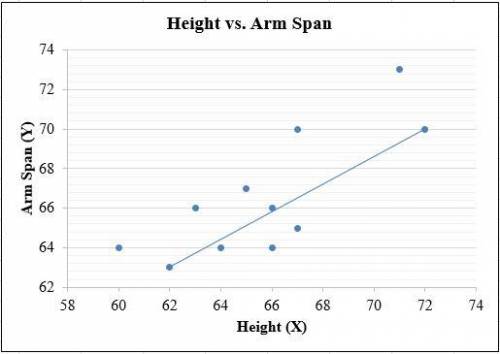
There are many measurements of the human body that are positively correlated. For example, the length of one's forearm (measured from elbow to wrist) is approximately the same length as the foot (measured from heel to toe). They are positively correlated because, as one measurement increases, so does the other measurement. You will discover through this project whether a human's arm span (measured across the body with the arms extended) is correlated to his height. You will need to collect data from 11 people, which will give you 12 data points including your own personal data. You will turn in and answer questions regarding only one scatter plot if doing the project alone. Part One: Measurements 1Measure your own height and arm span (from finger-tip to finger-tip) in inches. You will likely need some help from a parent, guardian, or sibling to get accurate measurements. Record your measurements on the "Data Record" document. Use the "Data Record " to help you complete Part Two of this project. 2Measure 11 additional people, and record their arm spans and heights in inches. Part Two: Representation of Data with Plots 1Using graphing software of your choice, create a scatter plot of your data. Predict the line of best fit, and sketch it on your graph. 2Copy and paste your scatter plot into a word processing document. Part Three: The Line of Best Fit Include your scatter plot and the answers to the following questions in your word processing document. 1Which variable did you plot on the x-axis, and which variable did you plot on the y-axis? Explain why you assigned the variables in that way. 2Write the equation of the line of best fit using the slope-intercept formula $y = mx + b$. Show all your work, including the points used to determine the slope and how the equation was determined. 3What does the slope of the line represent within the context of your graph? What does the y-intercept represent? 4Test the residuals of two other points to determine how well the line of best fit models the data. 5Use the line of best fit to help you to describe the data correlation. 6Using the line of best fit that you found in Part Three, Question 2, approximate how tall is a person whose arm span is 66 inches? 7According to your line of best fit, what is the arm span of a 74-inch-tall person?

Answers: 1
Another question on Mathematics
Mathematics, 21.06.2019 18:10
which of the following sets of data would produce the largest value for an independent-measures t statistic? the two sample means are 10 and 20 with variances of 20 and 25 the two sample means are 10 and 20 with variances of 120 and 125 the two sample means are 10 and 12 with sample variances of 20 and 25 the two sample means are 10 and 12 with variances of 120 and 125
Answers: 2
Mathematics, 21.06.2019 21:00
Simplify. 4+3/7x-2-2/7x a. 2-5/7x b. 6-1/7x c. 2+1/7x d. 6+5/7x
Answers: 1
Mathematics, 21.06.2019 22:10
Use the spider tool located on page 1 of this activity to draw a 12-pointed star for the new logo. (hint: if the spider rotates 360 degrees -- or 720 degrees or 1080 degrees -- she will be facing in the same direction in which she started. when the spider is done drawing, you want her to be facing in the same direction in which she started. she'll be making 12 rotations, all the same size, so each rotation must be some multiple of 360/12 = 30 degrees.) urgently. been stuck on this problem for around 45 minutes now.! it should be easy if you're smart enough
Answers: 3
Mathematics, 21.06.2019 23:30
In the diagram, ab is tangent to c, ab = 4 inches, and ad = 2 inches. find the radius of the circle.
Answers: 2
You know the right answer?
There are many measurements of the human body that are positively correlated. For example, the lengt...
Questions

Social Studies, 28.01.2020 07:31


Biology, 28.01.2020 07:31

History, 28.01.2020 07:31
Mathematics, 28.01.2020 07:31


Health, 28.01.2020 07:31

English, 28.01.2020 07:31
Mathematics, 28.01.2020 07:31
Mathematics, 28.01.2020 07:31
Social Studies, 28.01.2020 07:31


