Mathematics, 05.07.2020 14:01 imsatyam9365
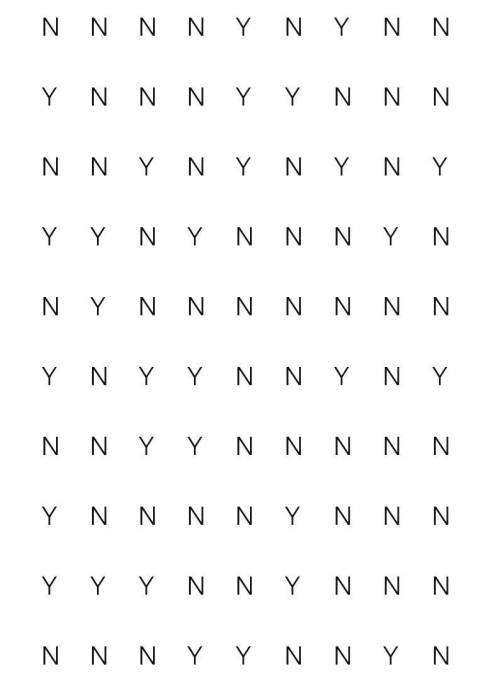
A national survey of companies included a question that asked whether the company had at least one bilingual telephone operator. The sample results of 90 companies (Y denotes that the company does have at least one bilingual operator; N denotes that it does not) are listed in the Excel file Bilingual. xlsx. Use the information to estimate with 80% confidence the proportion of the population that does have at least one bilingual operator. Round LCL and UCL values to 3 decimal places. Data file: Bilingual. xlsxPreview the document Group of answer choices LCL = 0.270, and UCL = 0.397 LCL = 0.252, and UCL = 0.415 LCL = 0.236, and UCL = 0.431 LCL = 0.205, and UCL = 0.461

Answers: 1
Another question on Mathematics

Mathematics, 21.06.2019 19:10
Click an item in the list or group of pictures at the bottom of the problem and, holding the button down, drag it into the correct position in the answer box. release your mouse button when the item is place. if you change your mind, drag the item to the trashcan. click the trashcan to clear all your answers. solve this quadratic equation using the quadratic formula. 2x2 - 2x=1 need asap
Answers: 2

Mathematics, 21.06.2019 21:00
What is the missing statement in step 4? ? rts ? ? vtu and ? rtu ? ? vts ? rts ? ? rvs and ? rtu ? ? stv ? vrs ? ? vru and ? usr ? ? usv ? vur ? ? vus and ? uvs ? ? sru
Answers: 3

Mathematics, 21.06.2019 21:20
The edge of a cube was found to be 30 cm with a possible error in measurement of 0.4 cm. use differentials to estimate the maximum possible error, relative error, and percentage error in computing the volume of the cube and the surface area of the cube. (round your answers to four decimal places.) (a) the volume of the cube maximum possible error cm3 relative error percentage error % (b) the surface area of the cube maximum possible error cm2 relative error percentage error %
Answers: 3

Mathematics, 22.06.2019 01:10
The graph below shows the line of best fit for data collected on the number of cell phones and cell phone cases sold at a local electronics store on twelve different days. number of cell phone cases sold 50 * 0 5 10 15 20 25 30 35 40 45 number of cell phones sold which of the following is the equation for the line of best fit? a. y = 0.8x b. y = 0.2x c. y=0.5x d. y = 0.25x
Answers: 3
You know the right answer?
A national survey of companies included a question that asked whether the company had at least one b...
Questions

Social Studies, 31.05.2021 02:00


Health, 31.05.2021 02:00

Biology, 31.05.2021 02:00

Chemistry, 31.05.2021 02:00

English, 31.05.2021 02:00


Mathematics, 31.05.2021 02:00

English, 31.05.2021 02:00

Mathematics, 31.05.2021 02:00


English, 31.05.2021 02:00

Spanish, 31.05.2021 02:00


