
Mathematics, 06.07.2020 01:01 12bluestone
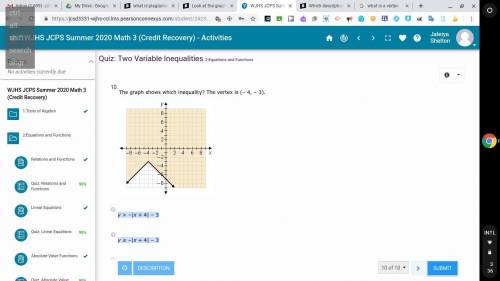
The graph shows which inequality? The vertex is (– 4, – 3). A. y > –|x + 4| – 3 B. y ≥ –|x + 4| – 3 C. y > –|x – 4| + 3 D. y ≥ –|x – 4| + 3

Answers: 2
Another question on Mathematics
Mathematics, 21.06.2019 15:00
If x = ∛200, which of the following inequalities is true? * 2 < x < 4 3 < x < 5 6 < x < 6.5 4.5 < x < 5.5 5 < x < 6
Answers: 1
Mathematics, 21.06.2019 15:30
Match each equation with the operation you can use to solve for the variable. 1 subtract 10 2 divide by 10 3add 18 4add 10 5 subtact 18 6multiply by 5. 7multiply by 10. a 5 = 10p b p + 10 = 18 c p + 18 = 5 d 5p = 10
Answers: 3
You know the right answer?
The graph shows which inequality? The vertex is (– 4, – 3). A. y > –|x + 4| – 3 B. y ≥ –|x + 4| –...
Questions


History, 22.06.2019 06:40
Mathematics, 22.06.2019 06:40
Mathematics, 22.06.2019 06:40
Mathematics, 22.06.2019 06:40
English, 22.06.2019 06:40

Computers and Technology, 22.06.2019 06:40
English, 22.06.2019 06:40
Mathematics, 22.06.2019 06:40


