
Mathematics, 08.07.2020 01:01 dominickstrickland
The U. S. Center for Disease Control reports that the mean life expectancy was 47.6 years for whites born in 1900 and 33.0 years for nonwhites. Suppose that you randomly survey death records for people born in 1900 in a certain county. Of the 124 whites, the mean life span was 45.3 years with a standard deviation of 12.7 years. Of the 82 nonwhites, the mean life span was 34.1 years with a standard deviation of 15.6 years.
Required:
a. Conduct a hypothesis test to see if the mean life spans in the county were the same for whites and nonwhites.
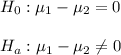
b. State the null and alternative hypotheses.
c. Which distribution (normal or Student's t) would you use for this hypothesis test?
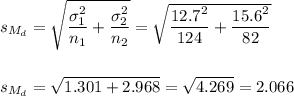
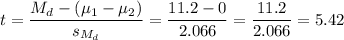
d. Calculate the test statistic and p-value.
e. Does it appear that the means are the same? Why or why not?

Answers: 1


Another question on Mathematics
Mathematics, 21.06.2019 17:00
Need this asap if anyone can i would be very grateful. if you could show workings that would really
Answers: 1
Mathematics, 21.06.2019 19:30
The revenue each season from tickets at the theme park is represented by t(c)=5x. the cost to pay the employees each season is represented by r(x)=(1.5)^x. examine the graph of the combined function for total profit and estimate the profit after four seasons
Answers: 3
Mathematics, 21.06.2019 20:00
True or false: the graph of y=f(bx) is a horizontal compression of the graph y=f(x) if b< 1
Answers: 2
You know the right answer?
The U. S. Center for Disease Control reports that the mean life expectancy was 47.6 years for whites...
Questions
Mathematics, 31.03.2020 18:20


History, 31.03.2020 18:21

Mathematics, 31.03.2020 18:21

Mathematics, 31.03.2020 18:21
English, 31.03.2020 18:21
Mathematics, 31.03.2020 18:21
History, 31.03.2020 18:21

Geography, 31.03.2020 18:21
Mathematics, 31.03.2020 18:21


