
Mathematics, 14.07.2020 20:01 C4171
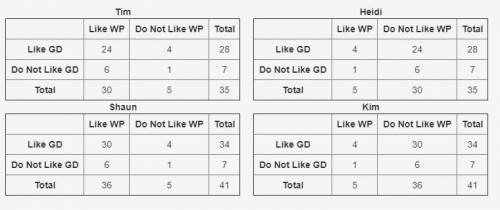
A group of students were surveyed to find out if they like walking pets and/or gardening during the holidays. The results of the survey are shown below: 30 students like walking pets 6 students like walking pets but do not like gardening 28 students like gardening 5 students do not like walking pets Four students created the tables below to represent the data. GD represents gardening and WP represents walking pets. Which student's table is correct? Tim Heidi Shaun Kim

Answers: 2
Another question on Mathematics
Mathematics, 21.06.2019 15:30
Find the slope of the line below . enter your answer as a fraction or decimal. use a slash mark ( / ) as the fraction bar if necessary
Answers: 3
Mathematics, 21.06.2019 19:30
Arestaurant chef made 1 1/2 jars of pasta sauce. each serving of pasta requires 1/2 of a jar of sauce. how many servings of pasta will the chef be able to prepare using the sauce?
Answers: 1
Mathematics, 21.06.2019 20:30
3.17 scores on stats final. below are final exam scores of 20 introductory statistics students. 1 2 3 4 5 6 7 8 9 10 11 12 13 14 15 16 17 18 19 20 57, 66, 69, 71, 72, 73, 74, 77, 78, 78, 79, 79, 81, 81, 82, 83, 83, 88, 89, 94 (a) the mean score is 77.7 points. with a standard deviation of 8.44 points. use this information to determine if the scores approximately follow the 68-95-99.7% rule. (b) do these data appear to follow a normal distribution? explain your reasoning using the graphs provided below.
Answers: 1
Mathematics, 21.06.2019 22:30
The given diagram shows the parts of a right triangle with an altitude to the hypotenuse. using the two given measures, find the other four.
Answers: 1
You know the right answer?
A group of students were surveyed to find out if they like walking pets and/or gardening during the...
Questions

Mathematics, 27.10.2020 17:40

Health, 27.10.2020 17:40
Mathematics, 27.10.2020 17:40


Social Studies, 27.10.2020 17:40
Mathematics, 27.10.2020 17:40
Mathematics, 27.10.2020 17:40
English, 27.10.2020 17:40

History, 27.10.2020 17:40

History, 27.10.2020 17:40


