B. {-2,2}

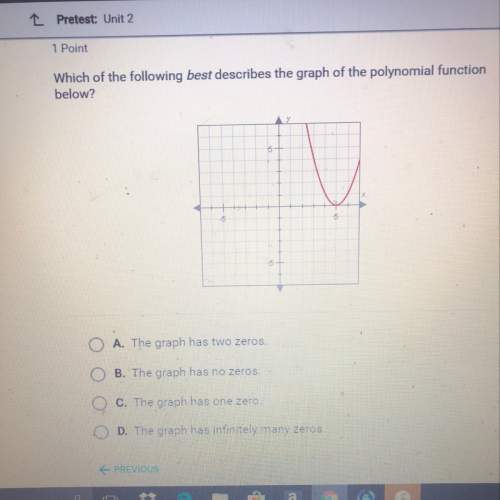
Mathematics, 14.07.2020 01:01 kimloveswim
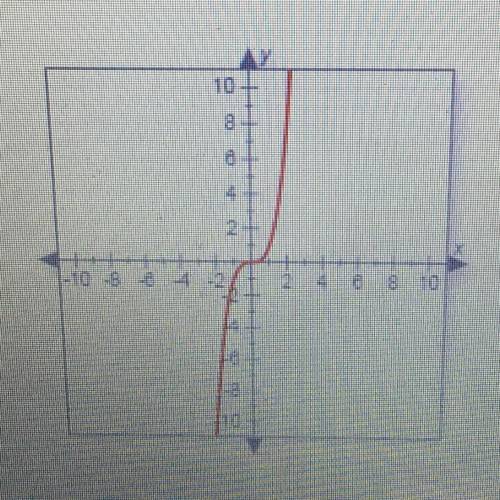
Identify the range of the function shown in the graph.
A. y is all real numbers.
B. {-2,2}
C. -2 < y < 2
D. Y > 0

Answers: 1
Another question on Mathematics
Mathematics, 21.06.2019 20:30
Create a question with this scenario you could ask that could be answered only by graphing or using logarithm. david estimated he had about 20 fish in his pond. a year later, there were about 1.5 times as many fish. the year after that, the number of fish increased by a factor of 1.5 again. the number of fish is modeled by f(x)=20(1.5)^x.
Answers: 1
Mathematics, 21.06.2019 23:30
Parabolas y=−2x^2 and y=2x^2+k intersect at points a and b that are in the third and the fourth quadrants respectively. find k if length of the segment ab is 5.
Answers: 1
You know the right answer?
Identify the range of the function shown in the graph.
A. y is all real numbers.
B. {-2,2}
B. {-2,2}
Questions


Chemistry, 04.01.2021 02:30
Mathematics, 04.01.2021 02:30


Biology, 04.01.2021 02:30
Mathematics, 04.01.2021 02:30
Mathematics, 04.01.2021 02:30
Physics, 04.01.2021 02:30
Mathematics, 04.01.2021 02:30


