Mathematics, 17.07.2020 01:01 nisha87
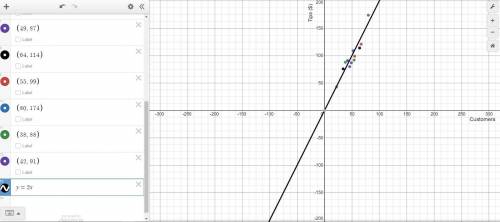
You and your business partner track the number of customers served and the amount of tips collected per day. The data you gathered is displayed in the chart below. Servers’ Collected Tips Customers 54 46 34 67 52 22 49 64 55 80 38 42 Tips ($) $92 $80 $76 $121 $109 $43 $87 $114 $99 $174 $88 $91 a) Create a scatterplot displaying the data in the table. Be sure to include a linear trend line

Answers: 2
Another question on Mathematics

Mathematics, 21.06.2019 18:40
Aportion of a hiking trail slopes downward at about an 84° angle. to the nearest tenth of a flot, what is the value of x, the distance the hiker traveled along the path, if he has traveled a horizontal distance of 120 feet? a. 143.3 b. 12.5 c. 120.7 d. 130.2
Answers: 1

Mathematics, 21.06.2019 20:00
Write the point-slope form of the line passing through (2, -12) and parallel to y=3x.
Answers: 3


Mathematics, 21.06.2019 23:00
Over the course of a month, a person's weight decreases. what type of relationship is this? a. positive relationship
Answers: 3
You know the right answer?
You and your business partner track the number of customers served and the amount of tips collected...
Questions


Mathematics, 10.07.2019 13:00

Business, 10.07.2019 13:00

Computers and Technology, 10.07.2019 13:00


Social Studies, 10.07.2019 13:00


Social Studies, 10.07.2019 13:00


History, 10.07.2019 13:00


Biology, 10.07.2019 13:00

Chemistry, 10.07.2019 13:00


