
Mathematics, 18.07.2020 06:01 amylumey2005
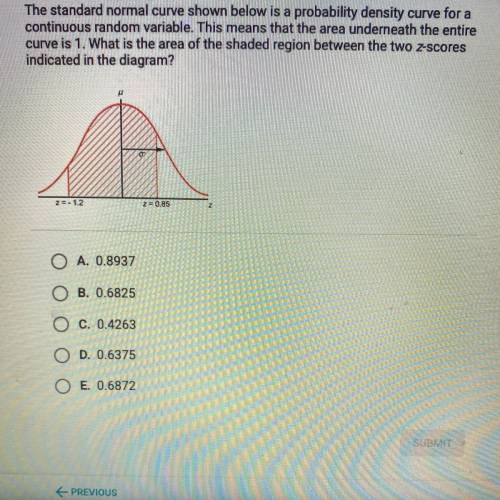
The standard normal curve shown below is a probability density curve for a
continuous random variable. This means that the area underneath the entire
curve is 1. What is the area of the shaded region between the two z-scores
indicated in the diagram? z=-1.2 z=0.85
A.0.8937
B.0.6825
C.0.4263
D.0.6375
E.0.6872

Answers: 3
Another question on Mathematics
Mathematics, 21.06.2019 14:00
Ataxi cab charges $1.75 for the flat fee and $0.25 for each time. write an in equality to determine how many miles eddie can travel if he has $15 to spend.
Answers: 1
Mathematics, 22.06.2019 01:30
Me i'm timed right now! a. (0,-5)b. (0,-3)c. (0,3) d. (0,5)
Answers: 2
Mathematics, 22.06.2019 02:00
The quotient of 15 and a number is 1 over 3 written as an equation
Answers: 1
You know the right answer?
The standard normal curve shown below is a probability density curve for a
continuous random variab...
Questions

History, 13.10.2020 05:01


Chemistry, 13.10.2020 05:01
English, 13.10.2020 05:01
History, 13.10.2020 05:01
Mathematics, 13.10.2020 05:01
Chemistry, 13.10.2020 05:01

English, 13.10.2020 05:01
Mathematics, 13.10.2020 05:01
Mathematics, 13.10.2020 05:01


Health, 13.10.2020 05:01


Geography, 13.10.2020 05:01


