
Mathematics, 21.07.2020 08:01 danetth18
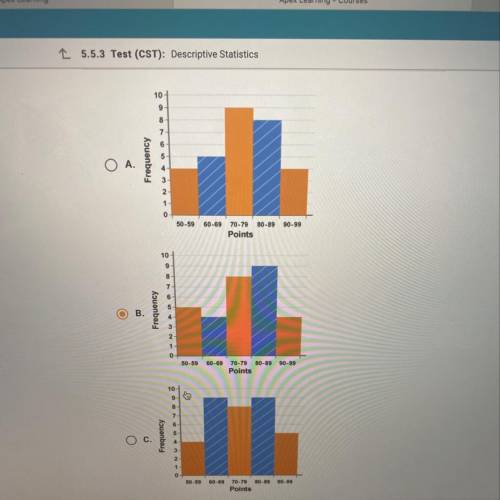
The frequency table shows the number of points scored during 30 Bulldogs
basketball games. On a piece of paper, draw a histogram to represent the
data. Then determine which answer choice matches the histogram you drew.
Points scored
Frequency
50 - 59
4
60 - 69
5
70 - 79
9
80 - 89
8
90 - 99
4
There is one more graph but I couldn’t fit it in the picture, if none of these seem right then it is probably that one.

Answers: 2
Another question on Mathematics
Mathematics, 21.06.2019 23:50
Solve for x in the equation x2 - 12x + 36 = 90. x= 6+3x/10 x=6+2/7 x= 12+3/22 x = 12+3/10
Answers: 2
Mathematics, 22.06.2019 03:40
Which is the value of this expression when p=3 and q=-9
Answers: 1
Mathematics, 22.06.2019 06:10
Azookeeper predicted the weight of a new baby elephant to be 233 pounds when it was born. the elephant actually weighed 265 pounds at birth. what was the percent error of the zookeeper's prediction? asap
Answers: 3
You know the right answer?
The frequency table shows the number of points scored during 30 Bulldogs
basketball games. On a pie...
Questions


English, 26.04.2020 11:46

Geography, 26.04.2020 11:46

Mathematics, 26.04.2020 11:46
Mathematics, 26.04.2020 11:46

Social Studies, 26.04.2020 11:47

History, 26.04.2020 11:47
Mathematics, 26.04.2020 11:48
Mathematics, 26.04.2020 11:48


Computers and Technology, 26.04.2020 11:48
Mathematics, 26.04.2020 11:48


