Mathematics, 29.07.2020 01:01 alexmoy45p8yd7v
Never forget that even small effects can be statistically significant if the samples are large. To illustrate this fact, consider a sample of 145 small businesses. During a three-year period, 14 of the 99 headed by men and 8 of the 46 headed by women failed.
(a) Find the proportions of failures for businesses headed by women and businesses headed by men. These sample proportions are quite close to each other. Give the P-value for the test of the hypothesis that the same proportion of women's and men's businesses fail. (Use the two-sided alternative). What can we conclude (Use a = 0.05)? The P-value was so we conclude that The test showed no significant difference.
(b) Now suppose that the same sample proportion came from a sample 30 times as large. That is, 240 out of 1380 businesses headed by women and 420 out of 2970 businesses headed by men fail. Verify that the proportions of failures are exactly the same as in part (a). Repeat the test for the new data. What can we conclude? The P-value was so we conclude that The test showed strong evidence of a significant difference.
(c) It is wise to use a confidence interval to estimate the size of an effect rather than just giving a P-value. Give 95% confidence intervals for the difference between proportions of men's and women's businesses (men minus women) that fail for the settings of both (a) and (b). (Be sure to check that the conditions are met. If the conditions aren't met for one of the intervals, use the same type of interval for both) Interval for smaller samples: to Interval for larger samples: to What is the effect of larger samples on the confidence interval? The confidence interval's margin of error is reduced.

Answers: 3
Another question on Mathematics

Mathematics, 21.06.2019 14:50
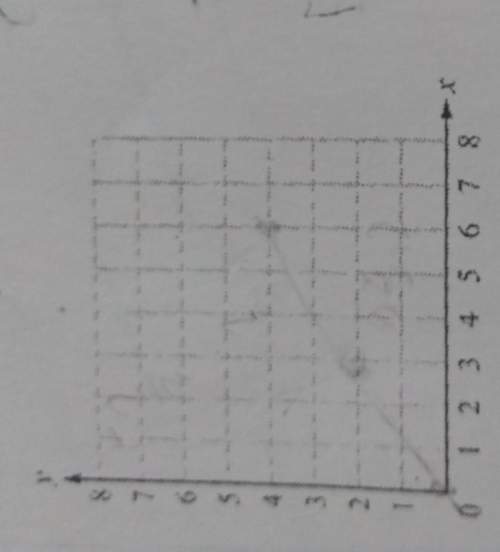
Eight people were asked what the balance of their savings account at the beginning of the month was and how much it increased or decreased by the end of the month. create a scatter plot that represents the data that is shown in the table. the x-axis represents the beginning balance in thousands of dollars and the y-axis represents the change in the savings account in hundreds of dollars. name beginning balance (in thousands of dollars) change in savings account (in hundreds of dollars) jimmy 5 3 kendra 4 7 carlos 5 4 yolanda 3 1 shawn 2 5 laura 3 2 andy 5 6 georgia 4 3
Answers: 1

Mathematics, 21.06.2019 15:30
In δabc, if the length of side b is 3 centimeters and the measures of ∠b and ∠c are 45° and 60°, respectively, what is the length of side c to two decimal places?
Answers: 1

Mathematics, 21.06.2019 22:30
If you prove that ∆wxz is congruent to ∆yzx, which general statement best describes what you have proved?
Answers: 3

Mathematics, 22.06.2019 02:00
Tanyss's house has 25 windows. her brother has washed 22 of the windows. what percent of the windows has her brother washed?
Answers: 1
You know the right answer?
Never forget that even small effects can be statistically significant if the samples are large. To i...
Questions


Mathematics, 06.07.2021 16:20


Mathematics, 06.07.2021 16:20


Mathematics, 06.07.2021 16:20

Mathematics, 06.07.2021 16:20


Social Studies, 06.07.2021 16:20

English, 06.07.2021 16:20


