
Mathematics, 12.08.2020 07:01 eboniwiley
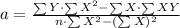
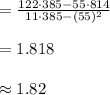
The graph below shows the relationship between the number of months different students practiced baseball and the number of games they won:
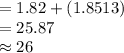
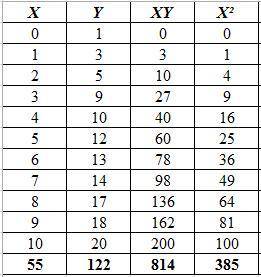
The title of the graph is Baseball Games. On x axis, the label is Number of Months of Practice. On y axis, the label is Number of Games Won. The scale on the y axis is from 0 to 22 at increments of 2, and the scale on the x axis is from 0 to 12 at increments of 2. The points plotted on the graph are the ordered pairs 0, 1 and 1, 3 and 2, 5 and 3, 9 and 4, 10 and 5, 12 and 6, 13 and 7, 14 and 8,17 and 9, 18 and 10,20. A straight line is drawn joining the ordered pairs 0, 1.8 and 2, 5.6 and 4, 9.2 and 6, 13 and 8, 16.5 and 10, 20.5.
Part A: What is the approximate y-intercept of the line of best fit and what does it represent? (5 points)
Part B: Write the equation for the line of best fit in slope-intercept form and use it to predict the number of games that could be won after 13 months of practice. Show your work and include the points used to calculate the slope. (5 points)

Answers: 3

Another question on Mathematics
Mathematics, 21.06.2019 17:30
1. if we have 3 babies what is the probability they’re going to be all boys? 2. if we roll 2 die at the same time what is the probability of getting less than 10 on the first roll and a 5 on the second roll 3. if we have 3 babies what is the probability their is going to be 2 girls? 4. if we have 3 babies what is the probability of having no more than 1 girl? 5. it we have 3 babies and then have another 3 babies what is the probability of us having at least 1 boy and then having all girls?
Answers: 1
Mathematics, 21.06.2019 20:30
Kyle and elijah are planning a road trip to california. their car travels 3/4 of a mile per min. if they did not stop driving, how many miles could kyle and elijah drove in a whole day? ? 1 day = 24 hours. plzzz write a proportion i will give you 100 points
Answers: 1
Mathematics, 21.06.2019 21:30
Questions 9-10. use the table of educational expenditures to answer the questions. k-12 education expenditures population indiana $9.97 billion 6.6 million illinois $28.54 billion 12.9 million kentucky $6.58 billion 4.4 million michigan $16.85 billion 9.9 million ohio $20.23 billion 11.6million 9. if the amount of k-12 education expenses in indiana were proportional to those in ohio, what would have been the expected value of k-12 expenditures in indiana? (give the answer in billions rounded to the nearest hundredth) 10. use the value of k-12 education expenditures in michigan as a proportion of the population in michigan to estimate what the value of k-12 education expenses would be in illinois. a) find the expected value of k-12 expenditures in illinois if illinois were proportional to michigan. (give the answer in billions rounded to the nearest hundredth) b) how does this compare to the actual value for k-12 expenditures in illinois? (lower, higher, same? )
Answers: 1
You know the right answer?
The graph below shows the relationship between the number of months different students practiced bas...
Questions

Chemistry, 10.06.2021 01:00

Advanced Placement (AP), 10.06.2021 01:00
Mathematics, 10.06.2021 01:00

Computers and Technology, 10.06.2021 01:00

English, 10.06.2021 01:00

Biology, 10.06.2021 01:00
Mathematics, 10.06.2021 01:00
Mathematics, 10.06.2021 01:00
Mathematics, 10.06.2021 01:00
Mathematics, 10.06.2021 01:00
Mathematics, 10.06.2021 01:00

English, 10.06.2021 01:00


