
Mathematics, 12.08.2020 04:01 jpsaad00
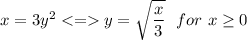
Find the area of the region enclosed by the curves x=3y^2, x=0, and y=2

Answers: 3
 , hence the integral is relative to y.The lower limit is when x = 0, hence
 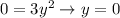 .The upper limit is when y = 2.


![\displaystyle \int\limits^{12}_0 {\sqrt{\dfrac{x}{3}}} \, dx =\dfrac{1}{\sqrt{3}} \int\limits^{12}_0 {\sqrt{x}} \, dx\\\\=\dfrac{1}{\sqrt{3}} \left[ \dfrac{2}{3}x^{3/2}\right]_0^{12}\\\\=\dfrac{1}{\sqrt{3}} *\dfrac{2}{3}*12*\sqrt{12}\\\\=\dfrac{2*12*2*\sqrt{3}}{3*\sqrt{3}}\\\\=2*4*2=16](/tpl/images/0717/8271/04c99.png)
Another question on Mathematics
Mathematics, 21.06.2019 16:10
The box plot shows the number of raisins found in sample boxes from brand c and from brand d. each box weighs the same. what could you infer by comparing the range of the data for each brand? a) a box of raisins from either brand has about 28 raisins. b) the number of raisins in boxes from brand c varies more than boxes from brand d. c) the number of raisins in boxes from brand d varies more than boxes from brand c. d) the number of raisins in boxes from either brand varies about the same.
Answers: 2
Mathematics, 21.06.2019 17:40
How can the correlation in the scatter plot graph below best be described? positive correlation negative correlation both positive and negative no correlation
Answers: 1
Mathematics, 21.06.2019 19:00
Ab based on the given diagram, if m_1 = 60° then m 2 = 30 60 90 180
Answers: 1
Mathematics, 21.06.2019 19:40
What is the slope of the line that contains the points (-2,1) and (0,-3)
Answers: 2
You know the right answer?
Find the area of the region enclosed by the curves x=3y^2, x=0, and y=2...
Questions


Biology, 19.01.2021 20:50
Mathematics, 19.01.2021 20:50
Mathematics, 19.01.2021 20:50


Arts, 19.01.2021 20:50

Social Studies, 19.01.2021 20:50
Mathematics, 19.01.2021 20:50
Mathematics, 19.01.2021 20:50
English, 19.01.2021 20:50


