Answer the following questions.
Division:
1. 61,982 ÷ 23
2. 803 ÷ 37
3. 816 ÷ 28...

Mathematics, 25.08.2020 08:01 AADJ4
Answer the following questions.
Division:
1. 61,982 ÷ 23
2. 803 ÷ 37
3. 816 ÷ 28
4. 219 ÷ 47
5. 2,624 ÷ 82
6. 50,000 ÷ 72
7. 1,333 ÷ 43
8. 6,528 ÷ 16
Multiplication (see image):
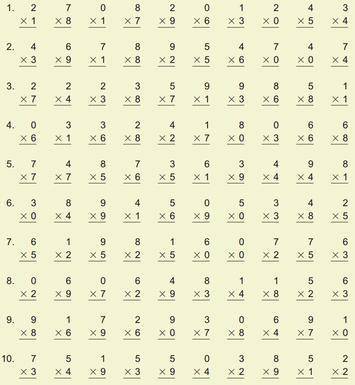

Answers: 1
Another question on Mathematics
Mathematics, 21.06.2019 22:00
Asales representative from a local radio station is trying to convince the owner of a small fitness club to advertise on her station. the representative says that if the owner begins advertising on the station today, the club's total number of members will grow exponentially each month. she uses the given expression to model the number of club members, in hundreds, after advertising for t months.
Answers: 2
Mathematics, 22.06.2019 00:00
(20 points) a bank has been receiving complaints from real estate agents that their customers have been waiting too long for mortgage confirmations. the bank prides itself on its mortgage application process and decides to investigate the claims. the bank manager takes a random sample of 20 customers whose mortgage applications have been processed in the last 6 months and finds the following wait times (in days): 5, 7, 22, 4, 12, 9, 9, 14, 3, 6, 5, 15, 10, 17, 12, 10, 9, 4, 10, 13 assume that the random variable x measures the number of days a customer waits for mortgage processing at this bank, and assume that x is normally distributed. 2a. find the sample mean of this data (x ě…). 2b. find the sample variance of x. find the variance of x ě…. for (c), (d), and (e), use the appropriate t-distribution 2c. find the 90% confidence interval for the population mean (îľ). 2d. test the hypothesis that îľ is equal to 7 at the 95% confidence level. (should you do a one-tailed or two-tailed test here? ) 2e. what is the approximate p-value of this hypothesis?
Answers: 2
Mathematics, 22.06.2019 01:10
The graph below shows the line of best fit for data collected on the number of cell phones and cell phone cases sold at a local electronics store on twelve different days. number of cell phone cases sold 50 * 0 5 10 15 20 25 30 35 40 45 number of cell phones sold which of the following is the equation for the line of best fit? a. y = 0.8x b. y = 0.2x c. y=0.5x d. y = 0.25x
Answers: 3
You know the right answer?
Questions
Mathematics, 22.08.2019 11:50

History, 22.08.2019 11:50


Mathematics, 22.08.2019 11:50
History, 22.08.2019 11:50
Mathematics, 22.08.2019 11:50
Mathematics, 22.08.2019 11:50
Mathematics, 22.08.2019 11:50

English, 22.08.2019 11:50

Chemistry, 22.08.2019 11:50
Social Studies, 22.08.2019 11:50
Chemistry, 22.08.2019 11:50


