2 1.1.4 Quiz: Graphical Data Analysis
Question 3 of 10
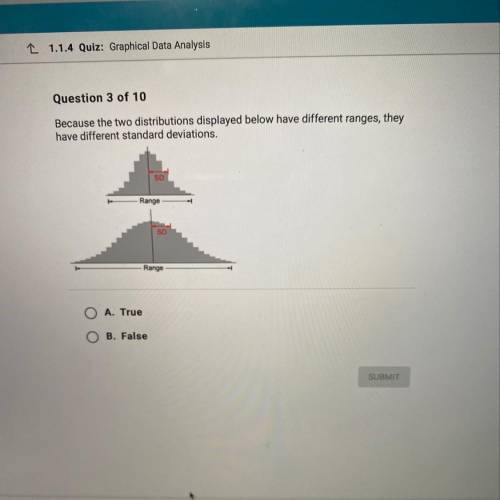
Because the two distributions displaye...

Mathematics, 26.08.2020 20:01 karose4590
2 1.1.4 Quiz: Graphical Data Analysis
Question 3 of 10
Because the two distributions displayed below have different ranges, they
have different standard deviations.
Range
Range
O A. True
O B. False
SUBMIT

Answers: 2
Another question on Mathematics
Mathematics, 21.06.2019 18:00
Aplane is taking off from bangladesh headed to new york city. at the same time, a plane from new york city is headed to bangladesh is also taking off. the plane bound to new york city is traveling at 600 mph, while the plane traveling to bangladesh is traveling at 400 mph. how far from new york city will the two planes meet if the distance between new york city and bangladesh is 8,000 miles?
Answers: 3
Mathematics, 21.06.2019 23:00
Mrs.sling bought a pound of green beans for $1.80. how much will mrs.tennison pay for 3 1/2 pounds of green beans?
Answers: 1
Mathematics, 21.06.2019 23:30
Aparking garage charges $1.12 for the first hour and 0.50 for each additional hour. what is the maximum length of time tom can park in the garage if we wishes to play no more than $5.62
Answers: 1
You know the right answer?
Questions
Mathematics, 22.04.2021 21:50

Computers and Technology, 22.04.2021 21:50

Mathematics, 22.04.2021 21:50
History, 22.04.2021 21:50
Mathematics, 22.04.2021 21:50

Social Studies, 22.04.2021 21:50
Mathematics, 22.04.2021 21:50
Mathematics, 22.04.2021 21:50
Mathematics, 22.04.2021 21:50

Mathematics, 22.04.2021 21:50
Computers and Technology, 22.04.2021 21:50
Mathematics, 22.04.2021 21:50

Mathematics, 22.04.2021 21:50
Mathematics, 22.04.2021 21:50

English, 22.04.2021 21:50


