2. Find the midpoint of the segment with the
endpoints of A (-5,9) and B (-2,7).
Find the dis...

Mathematics, 05.09.2020 07:01 Felixthecat8241
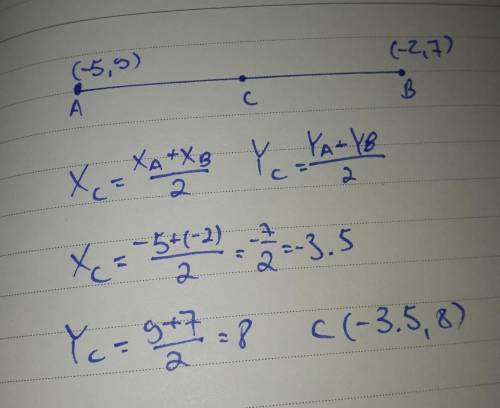
2. Find the midpoint of the segment with the
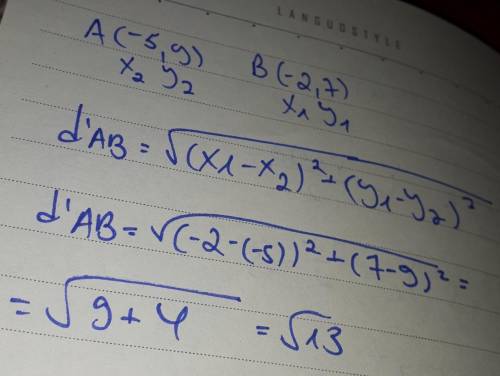
endpoints of A (-5,9) and B (-2,7).
Find the distance between A and B.

Answers: 2
Another question on Mathematics
Mathematics, 21.06.2019 21:30
Amira is painting a rectangular banner 2 1/4 yards wide. the banner will have a blue background. amira has enough paint to cover 1 1/2 square yards of the wall. the school colors are blue and yellow, so amira wants to add yellow rectangles on the left and right sides of the blue rectangle. the yellow rectangles will each be 3/4 yards wide and the same height as the blue rectangle. what will be the total area of the two yellow rectangles?
Answers: 3
Mathematics, 22.06.2019 02:30
The john nash mall used 17,4000 kilowatt hours in may, with a peak load of 92 kilowatts. the demand charge is $5.95 per kilowatt, and the energy charge is $0.08 per kilowatt hour. the fuel adjustment charge is $0.017 per kilowatt hour. what is the total electricity cost for may?
Answers: 2
Mathematics, 22.06.2019 03:00
Describe how the presence of possible outliers might be identified on the following. (a) histograms gap between the first bar and the rest of bars or between the last bar and the rest of bars large group of bars to the left or right of a gap higher center bar than surrounding bars gap around the center of the histogram higher far left or right bar than surrounding bars (b) dotplots large gap around the center of the data large gap between data on the far left side or the far right side and the rest of the data large groups of data to the left or right of a gap large group of data in the center of the dotplot large group of data on the left or right of the dotplot (c) stem-and-leaf displays several empty stems in the center of the stem-and-leaf display large group of data in stems on one of the far sides of the stem-and-leaf display large group of data near a gap several empty stems after stem including the lowest values or before stem including the highest values large group of data in the center stems (d) box-and-whisker plots data within the fences placed at q1 â’ 1.5(iqr) and at q3 + 1.5(iqr) data beyond the fences placed at q1 â’ 2(iqr) and at q3 + 2(iqr) data within the fences placed at q1 â’ 2(iqr) and at q3 + 2(iqr) data beyond the fences placed at q1 â’ 1.5(iqr) and at q3 + 1.5(iqr) data beyond the fences placed at q1 â’ 1(iqr) and at q3 + 1(iqr)
Answers: 1
Mathematics, 22.06.2019 04:40
A. 15 degrees b. 45 degrees c. 30 degrees d. 60 degrees
Answers: 1
You know the right answer?
Questions

Engineering, 13.09.2019 23:30
Chemistry, 13.09.2019 23:30
Engineering, 13.09.2019 23:30

Medicine, 13.09.2019 23:30


