
Mathematics, 19.09.2020 01:01 journeyhile5
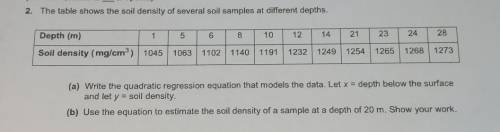
2. The table shows the soil density of several soil samples at different depths. Depth (m) 1 5 6 8 10 12 14 21 23 24 28 Soil density (mg/cm) 1045 1063 1102 1140 1191 1232 1249 1254 1265 1268 1273 (a) Write the quadratic regression equation that models the data. Let x = depth below the surface and let y = soil density. (b) Use the equation to estimate the soil density of a sample at a depth of 20 m. Show your work.

Answers: 1
Another question on Mathematics
Mathematics, 20.06.2019 18:04
Classify each polynomial by its degree and by its number of terms.
Answers: 1
Mathematics, 21.06.2019 20:00
For what type of equity loan are you lent a lump sum, which is to be paid within a certain period of time? a. a line of credit b. equity c. a second mortgage d. an amortization
Answers: 3
Mathematics, 21.06.2019 22:30
(a.s."similarity in right triangles"solve for xa.) 10b.) 20c.) 14.5d.) [tex] 6\sqrt{3} [/tex]
Answers: 1
You know the right answer?
2. The table shows the soil density of several soil samples at different depths. Depth (m) 1 5 6 8 1...
Questions
Mathematics, 30.11.2020 20:30

Spanish, 30.11.2020 20:30

Biology, 30.11.2020 20:30

Social Studies, 30.11.2020 20:30


Mathematics, 30.11.2020 20:30

Computers and Technology, 30.11.2020 20:30
Mathematics, 30.11.2020 20:30
Mathematics, 30.11.2020 20:30
Mathematics, 30.11.2020 20:30


