Strawberries Picked
100
90
80
70
60
Quarts Picked
40
30
20
10
1
8 9 10
Time hours)
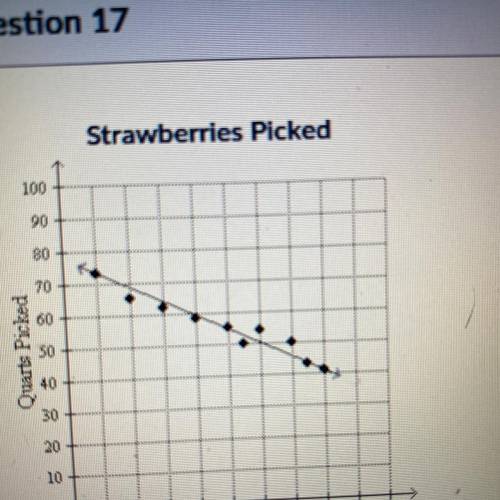
Use the scatter plot that shows the number of quarts of strawberries picked each hour. Use
the points (1, 73) and (8,41) to write the slope-intercept form of an equation for the line of
fit shown in the scatter plot.
Neoli is a nurse who works each day from 8: 00 am to 4: 00 pm at the blood collection centre. she takes 45 minutes for her lunch break. on average, it takes neoli 15 minutes to collect each sample and record the patient's details. on average, how many patients can neoli see each day?