
Mathematics, 29.09.2020 04:01 gigglegirl5802
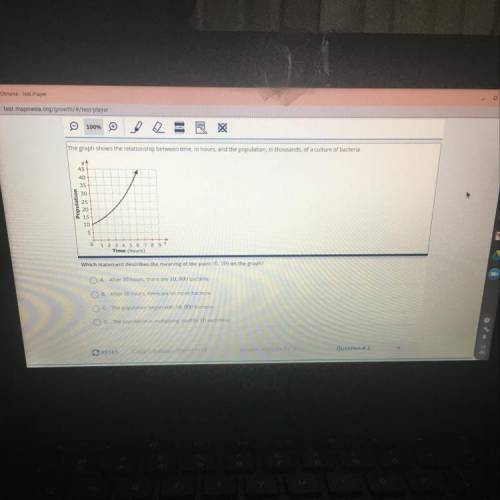
The graph shows the relationship between time, in hours, and the population, in thousands of a culture of bacteria.
+
45
40
35
30
Population
25
20
15
10
5
0 1 2 3 4 5 6 7 8
Time (hours)
which statement describes the meaning of the point (010) on the graph?
A After 10 hours there are 10.000 bacteria.
B. After 10 hours there are no more bacteria
C The population began with 10,000 bacteria
D. The population is multiplying itself by 10 each hour

Answers: 3
Another question on Mathematics
Mathematics, 21.06.2019 15:00
Which sum or difference identity would you use to verify that cos (180° - ∅) = -cos ∅? a. sin (α -β) = sin α cos β – cos α sin β b. cos (α -β) = cos α cos β – sin α sin β c. cos (α -β) = cos α cos β + sin α sin β d. sin (α + β) = sin α cos β + cos α sin β
Answers: 2
Mathematics, 21.06.2019 16:20
The number of potato chips in a bag is normally distributed with a mean of 71 and a standard deviation of 2. approximately what percent of bags contain between 69 and 73 potato chips? approximately 68% approximately 71% approximately 95% approximately 99.7%
Answers: 2
Mathematics, 21.06.2019 17:00
Complete the equation of the line through (−10,3) and (−8,−8). use exact numbers.
Answers: 1
Mathematics, 21.06.2019 22:00
The evening newspaper is delivered at a random time between 5: 30 and 6: 30 pm. dinner is at a random time between 6: 00 and 7: 00 pm. each spinner is spun 30 times and the newspaper arrived 19 times before dinner. determine the experimental probability of the newspaper arriving before dinner.
Answers: 1
You know the right answer?
The graph shows the relationship between time, in hours, and the population, in thousands of a cultu...
Questions
Mathematics, 05.05.2020 17:31

Mathematics, 05.05.2020 17:31


English, 05.05.2020 17:31
Mathematics, 05.05.2020 17:31

Chemistry, 05.05.2020 17:31
Mathematics, 05.05.2020 17:31
Biology, 05.05.2020 17:31


