
Mathematics, 29.09.2020 05:01 20jacksone
Help, please! :(
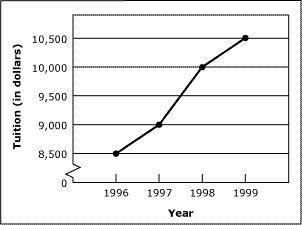
The line graph shows tuition amounts for a university for the years 1996 through 1999. Which of the following is a valid claim based on the graph?
(A): The greatest one-year increase in tuition occurred from 1997 to 1998.
(B): The rate of increase was the same from year to year.
(C): Tuition rates doubled between 1996 and 1999.
(D): Tuition rates will continue to increase over the next 5 years.

Answers: 3
Another question on Mathematics
Mathematics, 21.06.2019 17:30
What is not true about kl and mn? what is mn? (show your work)
Answers: 1
Mathematics, 21.06.2019 19:00
Use the quadratic formula to solve the equation. if necessary, round to the nearest hundredth. x^2 - 20 = x a. 5, 4 b. -5, -4 c. -5, 4 d. 5, -4
Answers: 2
Mathematics, 21.06.2019 20:00
Write the expression as a single natural logarithm. 2 in a - 4 in y
Answers: 1
You know the right answer?
Help, please! :(
The line graph shows tuition amounts for a university for the years 1996 through 1...
Questions
Mathematics, 29.08.2021 14:40

Social Studies, 29.08.2021 14:40

Computers and Technology, 29.08.2021 14:40

History, 29.08.2021 14:40


Chemistry, 29.08.2021 14:40

Social Studies, 29.08.2021 14:40

French, 29.08.2021 14:40
English, 29.08.2021 14:40
Computers and Technology, 29.08.2021 14:40
Mathematics, 29.08.2021 14:40
Mathematics, 29.08.2021 14:40
Mathematics, 29.08.2021 14:40
Social Studies, 29.08.2021 14:40

Health, 29.08.2021 14:50
English, 29.08.2021 14:50


