The graph shows witch inequality? (picture included)
1. -2.5 + y < 5
2. y is less than or...

Mathematics, 29.09.2020 14:01 smcardenas02
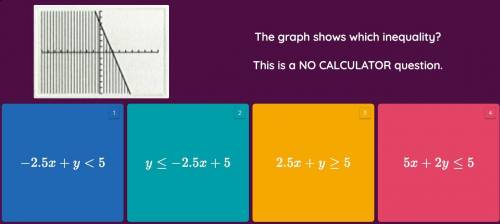
The graph shows witch inequality? (picture included)
1. -2.5 + y < 5
2. y is less than or equal to -2.5x + 5
3. 2.5x + y is greater than or equal to 5
4. 5x + 2y is less than or equal to 5

Answers: 1
Another question on Mathematics
Mathematics, 21.06.2019 13:00
What is the ratio for the surface areas of rectangle prisims shown below given that they are similar and that the ratio of their edge lengths is 7: 3
Answers: 1
Mathematics, 21.06.2019 21:00
Atriangular field has sides of lengths 21, 39, and 41 yd. find the largest angle. (round your answer to the nearest degree.)
Answers: 1
Mathematics, 21.06.2019 22:10
Monitors manufactured by tsi electronics have life spans that have a normal distribution with a standard deviation of 1800 hours and a mean life span of 20,000 hours. if a monitor is selected at random, find the probability that the life span of the monitor will be more than 17,659 hours. round your answer to four decimal places.
Answers: 2
Mathematics, 21.06.2019 23:00
The height of a birch tree, f(x), in inches, after x months is shown in the graph below. how much does the birch tree grow per month, and what will be the height of the birch tree after 10 months? a. the birch tree grows 1 inch per month. the height of the birch tree will be 16 inches after 10 months. b. the birch tree grows 2 inches per month. the height of the birch tree will be 26 inches after 10 months. c. the birch tree grows 3 inches per month. the height of the birch tree will be 36 inches after 10 months. d. the birch tree grows 2 inches per month. the height of the birch tree will be 24 inches after 10 months.
Answers: 1
You know the right answer?
Questions


History, 28.06.2020 02:01
Engineering, 28.06.2020 02:01

Computers and Technology, 28.06.2020 02:01
Computers and Technology, 28.06.2020 02:01


