
Mathematics, 04.10.2020 05:01 winterblanco
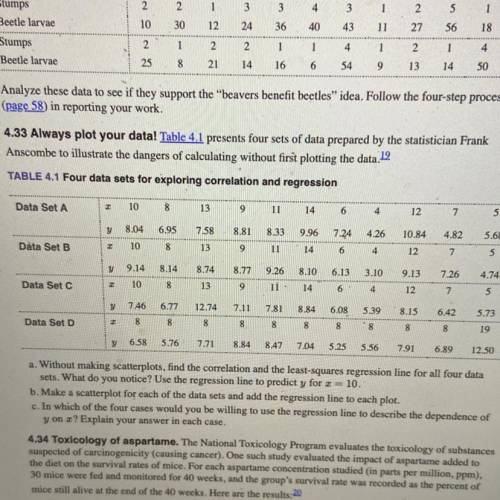
4.33 Always plot your data! Table 4.1 presents four sets of data prepared by the statistician Frank
Anscombe to illustrate the dangers of calculating without first plotting the data.12
TABLE 4.1 Four data sets for exploring correlation and regression
Data Set A
10
8
13
9
11
14
6
12
5
y 8.04
6.95
4.82
5.68
7.58
13
8.818.33 9.96 7.24 4.26
11 14 6
10.84
12
10
8
9
Data Set B
y
9.14
8.14
8.77
8.10
6.13
3.10
9.13
7.26
4.74
8.74
13
9.26
11
2
Data Set C
10
00
8
9
14
6
4
12
5
y 7.46
6.77
7.81
8.84
5.39
8.15
6.42
12.74
8
7.11
8
6.08
8
5.73
19
8
8
8
8
Data Set D
8
8
8
y 6.58 5.76 7.71
8.848.47 7.04 5.25 5.56
791
6.89
12.50
a. Without making scatterplots, find the correlation and the least-squares regression line for all four data
sets. What do you notice? Use the regression line to predict y for x = 10.
b. Make a scatterplot for each of the data sets and add the regression line to each plot.
c. In which of the four cases would you be willing to use the regression line to describe the dependence of
y on ar? Explain your answer in each case.

Answers: 3
Another question on Mathematics
Mathematics, 21.06.2019 13:30
Estimate the product. round the first factor to the nearest whole number, round the second factor to the nearest ten, and then multiply. 3 8/9 × 96
Answers: 3
Mathematics, 21.06.2019 19:30
Koji is installing a rectangular window in an office building. the window is 823 feet wide and 534 feet high. the formula for the area of a rectangle is a=bh. what is the area of the window? enter your answer as a mixed number in simplest form in the box. $$ ft2
Answers: 1
Mathematics, 22.06.2019 02:30
Solve the system of equations. 2x-2y=-4 and x+y=8. show work
Answers: 1
You know the right answer?
4.33 Always plot your data! Table 4.1 presents four sets of data prepared by the statistician Frank...
Questions
Mathematics, 19.12.2021 18:10


Computers and Technology, 19.12.2021 18:10
Mathematics, 19.12.2021 18:10


English, 19.12.2021 18:10
Computers and Technology, 19.12.2021 18:20
Mathematics, 19.12.2021 18:20


