Identify the range of the function shown in the graph.
10
A
-10
A. y> 0
...

Mathematics, 05.10.2020 20:01 sarahjohnson5621
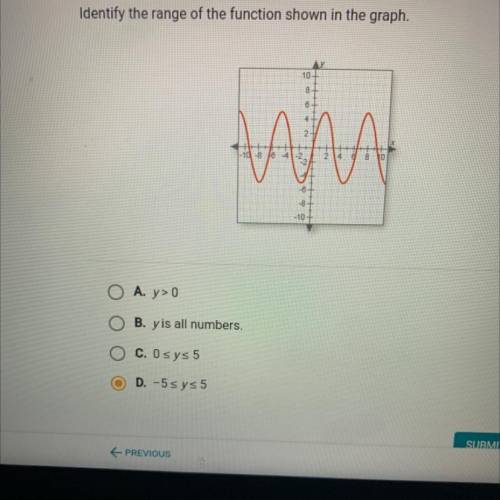
Identify the range of the function shown in the graph.
10
A
-10
A. y> 0
O
B. yis all numbers.
C. O sys 5
D. -5 sys 5

Answers: 2
Another question on Mathematics
Mathematics, 21.06.2019 17:30
Lems1. the following data set represents the scores on intelligence quotient(iq) examinations of 40 sixth-grade students at a particular school: 114, 122, 103, 118, 99, 105, 134, 125, 117, 106, 109, 104, 111, 127,133, 111, 117, 103, 120, 98, 100, 130, 141, 119, 128, 106, 109, 115,113, 121, 100, 130, 125, 117, 119, 113, 104, 108, 110, 102(a) present this data set in a frequency histogram.(b) which class interval contains the greatest number of data values? (c) is there a roughly equal number of data in each class interval? (d) does the histogram appear to be approximately symmetric? if so,about which interval is it approximately symmetric?
Answers: 3
Mathematics, 21.06.2019 19:30
Write the sine and cosine values of a, b, respectively, in the figure for (1) and (2) + explanation.
Answers: 1
Mathematics, 22.06.2019 00:00
Fill in the blank 1. a rhombus is a rectangle a) always b) sometimes c) never 2. a square is a quadrilateral a) always b) sometimes c) never 3. a trapezoid is a kite a) always b) sometimes c) never 4. a quadrilateral is a kite a) always b) sometimes c) never 5. a square is a rhombus a) always b) sometimes c) never 6. a parallelogram is a rectangle a) always b) sometimes c) never
Answers: 1
You know the right answer?
Questions

History, 20.04.2021 21:10
Mathematics, 20.04.2021 21:10
Mathematics, 20.04.2021 21:10

Computers and Technology, 20.04.2021 21:10

History, 20.04.2021 21:10
History, 20.04.2021 21:10
Engineering, 20.04.2021 21:10

English, 20.04.2021 21:10

Biology, 20.04.2021 21:10
Biology, 20.04.2021 21:10


