Solve the following system of equations graphically on the set of axes below.
Y = x + 7
Y = -...

Mathematics, 05.10.2020 20:01 jakeyywashere
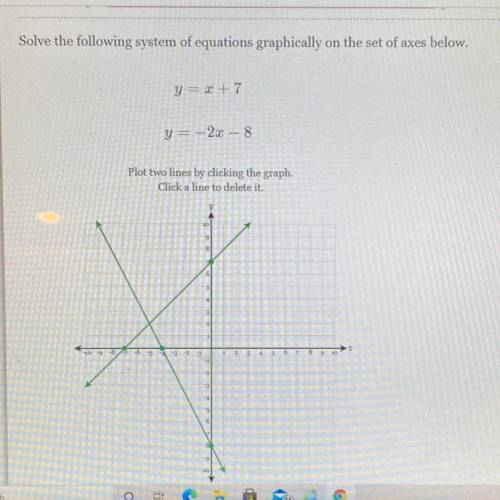
Solve the following system of equations graphically on the set of axes below.
Y = x + 7
Y = -2x + 8
Plot two lines by clicking the graph and click a line to delete it

Answers: 3
Another question on Mathematics
Mathematics, 21.06.2019 21:20
Rose bought a new hat when she was on vacation. the following formula describes the percent sales tax rose paid b=t-c/c
Answers: 3
Mathematics, 22.06.2019 00:30
Hi i’m not sure how to do question 20 if u could explain how to do it that’d b great
Answers: 1
Mathematics, 22.06.2019 03:50
Arandom sample of n = 25 observations is taken from a n(µ, σ ) population. a 95% confidence interval for µ was calculated to be (42.16, 57.84). the researcher feels that this interval is too wide. you want to reduce the interval to a width at most 12 units. a) for a confidence level of 95%, calculate the smallest sample size needed. b) for a sample size fixed at n = 25, calculate the largest confidence level 100(1 − α)% needed.
Answers: 3
You know the right answer?
Questions

History, 01.07.2019 18:30

English, 01.07.2019 18:30
English, 01.07.2019 18:30
Mathematics, 01.07.2019 18:30
Mathematics, 01.07.2019 18:30
Mathematics, 01.07.2019 18:30
Mathematics, 01.07.2019 18:30
History, 01.07.2019 18:30


