
Mathematics, 06.10.2020 14:01 Penelope9687
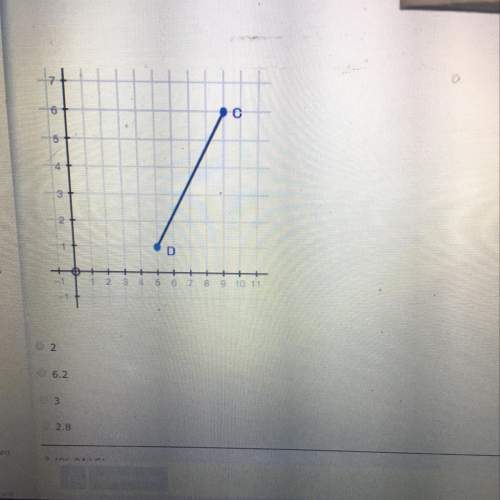
Which statement best describes the function represented by the graph?
The function is decreasing on the interval (-00, 0)
and increasing on the interval (0, 0).
131
10
B
The function is increasing on the interval (-00, 0)
and decreasing on the interval (0, 0).
6
4
2
The function is decreasing on the interval (-00, 0o).
-6
2
4
6
8%
-4-20
- 2
The function is increasing on the interval (-0, 0).


Answers: 3

Another question on Mathematics
Mathematics, 21.06.2019 16:00
Aswim teacher sells lesson packages. the best deal has the highest ratio of lessons to total cost.swim lesson packagesnumber of lessons total cost$10$4010 1 $8015$80which package is the best deal? l lesson for $105 lessons for $4010 lessons for $8015 lessons for $80mark this and returnsave and exit
Answers: 3
Mathematics, 21.06.2019 19:30
Піf x = y and y= z, which statement must be true? оа. -x = -2 b. x= z ос. —x = 2 od. 2= x
Answers: 3
Mathematics, 21.06.2019 20:00
Which fraction is equal to 1hole and 2/5? a.3/5 b.75 c.57 d.73
Answers: 2
Mathematics, 22.06.2019 02:10
Overproduction of uric acid in the body can be an indication of cell breakdown. this may be an advance indication of illness such as gout, leukemia, or lymphoma.† over a period of months, an adult male patient has taken nine blood tests for uric acid. the mean concentration was x = 5.35 mg/dl. the distribution of uric acid in healthy adult males can be assumed to be normal, with σ = 1.87 mg/dl. (a) find a 95% confidence interval for the population mean concentration of uric acid in this patient's blood. what is the margin of error? (round your answers to two decimal places.) lower limit upper limit margin of error (b) what conditions are necessary for your calculations? (select all that apply.) σ is unknown n is large σ is known normal distribution of uric acid uniform distribution of uric acid (c) interpret your results in the context of this problem. there is not enough information to make an interpretation. the probability that this interval contains the true average uric acid level for this patient is 0.05. the probability that this interval contains the true average uric acid level for this patient is 0.95. there is a 95% chance that the confidence interval is one of the intervals containing the population average uric acid level for this patient. there is a 5% chance that the confidence interval is one of the intervals containing the population average uric acid level for this patient. (d) find the sample size necessary for a 95% confidence level with maximal margin of error e = 1.10 for the mean concentration of uric acid in this patient's blood. (round your answer up to the nearest whole number.) blood tests
Answers: 2
You know the right answer?
Which statement best describes the function represented by the graph?
The function is decreasing on...
Questions
Mathematics, 13.09.2019 08:20
Mathematics, 13.09.2019 08:20

English, 13.09.2019 08:20

Mathematics, 13.09.2019 08:20
Mathematics, 13.09.2019 08:20

Mathematics, 13.09.2019 08:20

Geography, 13.09.2019 08:20
Mathematics, 13.09.2019 08:20
History, 13.09.2019 08:20

Computers and Technology, 13.09.2019 08:20


