
Mathematics, 07.10.2020 19:01 AM28
Population Growth
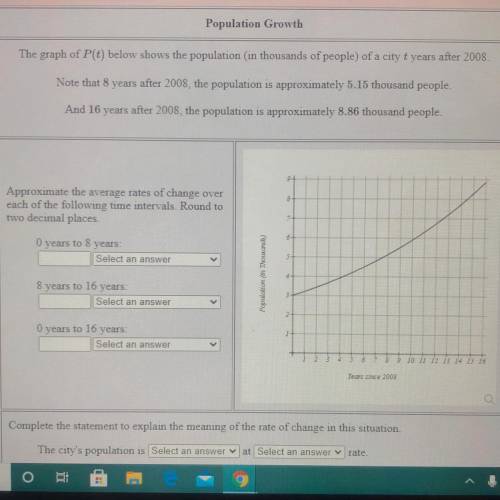
The graph of P(t) below shows the population in thousands of people) of a city t years after 2008.
Note that 8 years after 2008, the population is approximately 5.15 thousand people.
And 16 years after 2008, the population is approximately 8.86 thousand people
8
7
Approximate the average rates of change over
each of the following time intervals. Round to
two decimal places
O years to 8 years:
Select an answer
6
5
Population (or Zo)
8 years to 16 years:
Select an answer
0 years to 16 years
Select an answer
6 7 8 9 10 11 12 13 14 15 16
Years since 2008
Q

Answers: 3
Another question on Mathematics
Mathematics, 21.06.2019 16:30
A, b, c, and d have the coordinates (-8, 1), (-2, 4), (-3, -1), and (-6, 5), respectively. which sentence about the points is true? a. a, b, c, and d lie on the same line. b. and are perpendicular lines. c. and are parallel lines. d. and are intersecting lines but are not perpendicular. e. and are parallel lines.
Answers: 1
Mathematics, 21.06.2019 18:30
An ulcer medication has 300 milligrams in 2 tablets. how many milligrams are in 3 tablets?
Answers: 1
Mathematics, 21.06.2019 19:30
Finally, the arena decides to offer advertising space on the jerseys of the arena’s own amateur volley ball team. the arena wants the probability of being shortlisted to be 0.14. what is this as a percentage and a fraction? what is the probability of not being shortlisted? give your answer as a decimal. those shortlisted are entered into a final game of chance. there are six balls in a bag (2 blue balls, 2 green balls and 2 golden balls). to win, a company needs to take out two golden balls. the first ball is not replaced. what is the probability of any company winning advertising space on their volley ball team jerseys?
Answers: 3
You know the right answer?
Population Growth
The graph of P(t) below shows the population in thousands of people) of a city t...
Questions

History, 11.01.2021 19:30

English, 11.01.2021 19:30

Chemistry, 11.01.2021 19:30

Health, 11.01.2021 19:30
English, 11.01.2021 19:30

History, 11.01.2021 19:30
Mathematics, 11.01.2021 19:30
History, 11.01.2021 19:30
Mathematics, 11.01.2021 19:30
English, 11.01.2021 19:30
Mathematics, 11.01.2021 19:30


