
Mathematics, 09.10.2020 20:01 milkshakegrande101
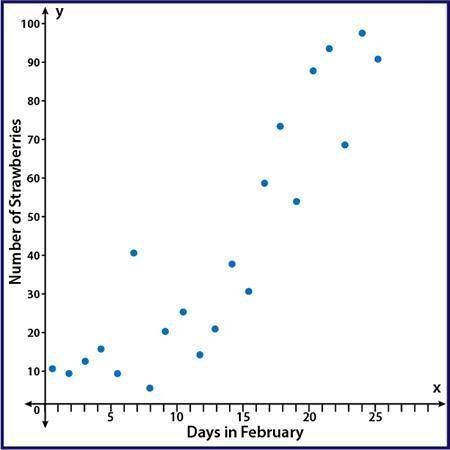
The scatter plot shows the number of strawberries that have been picked on the farm during the month of February:
A scatter plot with points showing an upward trend with points that are moderately spread out from a line of best fit. The y axis is labeled Number of Strawberries and the x axis is labeled Days in February
Part A: Using computer software, a correlation coefficient of r = 0.01 was calculated. Based on the scatter plot, is that an accurate value for this data? Why or why not? (5 points)
Part B: Instead of comparing the number of strawberries picked and the day in February, write a scenario that would be a causal relationship for strawberries picked on the farm. (5 points)

Answers: 1
Another question on Mathematics
Mathematics, 21.06.2019 12:50
What is the value of y in the solution to the system of equations? x + y = 12x – 3y = –30a. –8b. –3c. 3d. 8
Answers: 1
Mathematics, 21.06.2019 20:30
Kayaks rent for $35 per day. which expression can you use to find the cost in dollars of renting 3 kayaks for a day?
Answers: 1
Mathematics, 21.06.2019 23:30
Ana earns 2.5% simple interest on $2,000 in her savings account. she does not make any deposits or withdrawals. after 3 years, how much interest will ana have earned on her savings account?
Answers: 1
You know the right answer?
The scatter plot shows the number of strawberries that have been picked on the farm during the month...
Questions


Physics, 22.04.2020 15:48

Mathematics, 22.04.2020 15:48
Mathematics, 22.04.2020 15:48

English, 22.04.2020 15:48


Chemistry, 22.04.2020 15:48


