
Mathematics, 13.10.2020 03:01 jcox626
2.Use the following graph to estimate the rate of change of the function at x=0.5 using the points (−1,−1) and (1,3)
A. The rate of change is −1/2.
B. The rate of change is 2.
C. The rate of change is 1/2.
D. The rate of change is −2.
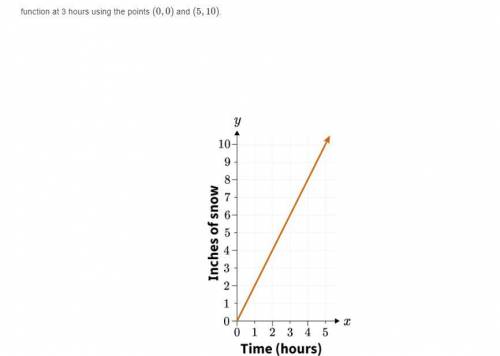
3.The following graph shows the inches of snow on the ground over a certain number of hours. Use the graph to estimate the rate of change of the function at 3 hours using the points (0,0) and (5,10)
A. The rate of change is −1/2 of an inch per hour.
B. The rate of change is 1/2 of an inch per hour.
C. The rate of change is 2 inches per hour.
D. The rate of change is −2 inches per hour.
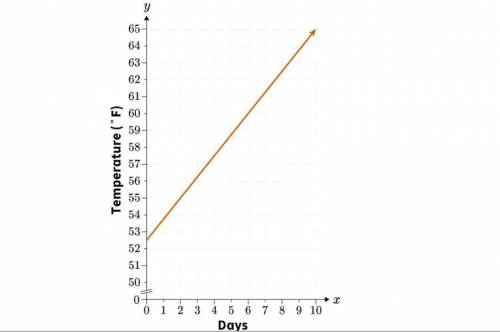
4.The following graph shows the average temperatures in degrees Fahrenheit (°F) over the days of a month. Use the graph to estimate the rate of change of the function at the ninth day of the month using the points (2,55) and (10,65)
A. The rate of change is 0.8 degrees Fahrenheit per day.
B. The rate of change is 1.25 degrees Fahrenheit per day.
C. The rate of change is −0.8 degrees Fahrenheit per day.
D. The rate of change is −1.25 degrees Fahrenheit per day.
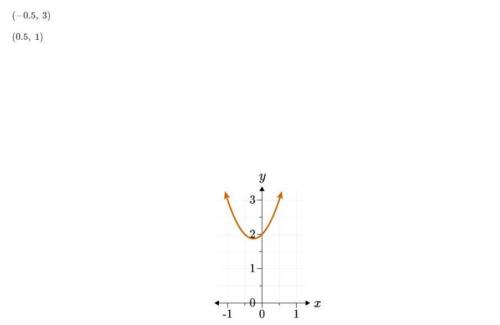
5.Use the following graph to answer which of the following points would provide the most accurate estimation for the rate of change of the function as it crosses the y-axis. Explain.
(−0.5, 2)
(0.5, 3)
(−0.5, 3)
(0.5, 1)
A.(−0.5, 3) and (0.5, 1) would provide the most accurate estimation. The slope of the line drawn between these two points appears closest to the slope of the function at x=0.
B.(−0.5, 2) and (0.5, 3) would provide the most accurate estimation. The slope of the line drawn between these two points appears closest to the opposite of the slope of the function at x=0.
C.(−0.5, 2) and (0.5, 3) would provide the most accurate estimation. The slope of the line drawn between these two points appears closest to the slope of the function at x=0.
D.(−0.5, 3) and (0.5, 1) would provide the most accurate estimation. The slope of the line drawn between these two points appears closest to the opposite of the slope of the function at x=0.


Answers: 3

Another question on Mathematics
Mathematics, 21.06.2019 19:20
Which number line represents the solution set for the inequality - x 24?
Answers: 3
Mathematics, 21.06.2019 20:00
The boiling point of water at an elevation of 0 feet is 212 degrees fahrenheit (°f). for every 1,000 feet of increase in elevation, the boiling point of water decreases by about 2°f. which of the following represents this relationship if b is the boiling point of water at an elevation of e thousand feet? a) e = 2b - 212 b) b = 2e - 212 c) e = -2b + 212 d) b = -2e + 212
Answers: 1
Mathematics, 21.06.2019 21:30
Hey hotel charges guests $19.75 a day to rent five video games at this rate which expression can be used to determine the charge for renting nine video games for one day at this hotel? pls
Answers: 1
Mathematics, 21.06.2019 21:30
Taylor wants to paint his rectangular deck that is 41 feet long and 24 feet wide. a gallon of paint covers about 350 square feet. how many gallons of paint will taylor need to cover the entire deck? round your answers to two decimal places when necessary.
Answers: 1
You know the right answer?
2.Use the following graph to estimate the rate of change of the function at x=0.5 using the points (...
Questions
Mathematics, 01.11.2019 13:31


History, 01.11.2019 13:31
Biology, 01.11.2019 13:31
English, 01.11.2019 13:31
History, 01.11.2019 13:31
Mathematics, 01.11.2019 13:31

Chemistry, 01.11.2019 13:31

History, 01.11.2019 13:31

Social Studies, 01.11.2019 13:31
Social Studies, 01.11.2019 13:31

Computers and Technology, 01.11.2019 13:31
Mathematics, 01.11.2019 13:31
Mathematics, 01.11.2019 13:31


