
Mathematics, 13.10.2020 14:01 windline829
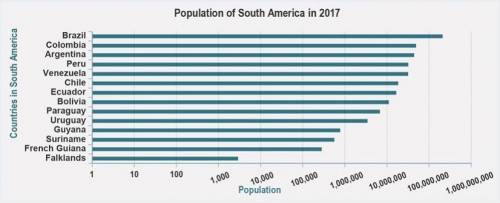
Examine the graph of populations in South American countries.
A bar graph of population in South America in 2017. The x-axis is labeled population from 1 to 1,000,000,000. The y-axis is labeled countries in South America. Brazil is over 100,000,000. Colombia is over 10,000,000. Argentina is over 10,000,000 but less than Colombia. Peru, Venezuela, Chile, Bolivia and Ecuador are over 10,000,000. Paraguay and Uruguay are over 1,000,000. Guyana, Suriname, and French Guiana are over 100,000. Falklands is over 1,000.
Which is the best conclusion that can be drawn from the data in the graph?
The most-populous cities in South America are in Brazil.
Colombia is South America’s second most-populous country.
Brazil has the fastest-growing population of any South American country.
The Falklands have always been South America’s least-populous country.

Answers: 2
Another question on Mathematics
Mathematics, 21.06.2019 22:30
The given diagram shows the parts of a right triangle with an altitude to the hypotenuse. using the two given measures, find the other four.
Answers: 1
You know the right answer?
Examine the graph of populations in South American countries.
A bar graph of population in South Am...
Questions


Mathematics, 09.10.2019 04:50

Chemistry, 09.10.2019 04:50

Health, 09.10.2019 04:50
English, 09.10.2019 04:50

History, 09.10.2019 04:50
Mathematics, 09.10.2019 04:50
Mathematics, 09.10.2019 04:50
Mathematics, 09.10.2019 04:50

Chemistry, 09.10.2019 04:50

Health, 09.10.2019 04:50


