
Mathematics, 14.10.2020 20:01 tanviknawale
1
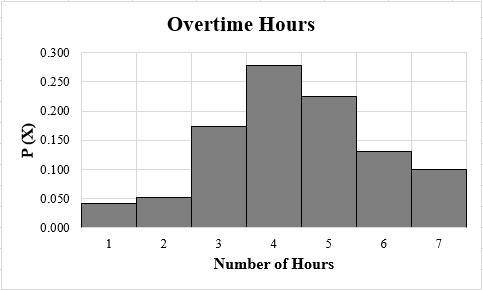
The data given below show the number of overtime hours worked in one week per employee. Use the data to complete parts (a) and (b).
Overtime hours
0
2 3 4 5 6
Employees
8 10 33 53 43 25 19
(a) Construct a probability distribution
(b) Graph the probability distribution using a histogram and describe its shape.
(a) Construct the probability distribution by completing the table below.
1
2
3
4
5
6
P(x)
1
(Round to three decimal places as needed.)

Answers: 3

Another question on Mathematics
Mathematics, 21.06.2019 23:30
In an isosceles triangle, the vertex angle is 112 degrees. what is the measure of each base. a.34 b.24 c.44 d.54
Answers: 1
Mathematics, 22.06.2019 00:00
Given the diagram below, michael writes, "segment ac is congruent to segment ac." which of the following reasons allow him to write this statement?
Answers: 1
Mathematics, 22.06.2019 01:30
What is the slope of the line passing through the points (-5, 7) and (-3,5)?
Answers: 1
Mathematics, 22.06.2019 02:30
Which number completes the system of linear inequalities represented by the graph? y > 2x – 2 and x + 4y >
Answers: 1
You know the right answer?
1
The data given below show the number of overtime hours worked in one week per employee. Use the d...
Questions

Geography, 30.09.2021 17:10

Physics, 30.09.2021 17:10

Social Studies, 30.09.2021 17:10

Mathematics, 30.09.2021 17:10
Mathematics, 30.09.2021 17:10

Business, 30.09.2021 17:10


Business, 30.09.2021 17:10
Biology, 30.09.2021 17:10
Physics, 30.09.2021 17:10
History, 30.09.2021 17:10

Business, 30.09.2021 17:10


