
Mathematics, 16.10.2020 14:01 kadariusmerchan
The following data represent the high-temperature distribution for a summer month in a city for some of the last 130 years. Treat the data as a population. Complete parts (a) through (c).
Temperature Lower Limit Upper Limit Days
50-59 50 59 2
60-69 60 69 313
70-79 70 79 1419
80-89 80 89 1503
90-99 90 99 319
100-109 100 109 9
Required:
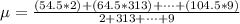
Approximate the mean and standard deviation for temperature.

Answers: 1

 Days
Days

![\sigma = \sqrt{ \frac{\sum[ f_i * ( x_i^2 - \= x^2)] }{\sum f_i}}](/tpl/images/0810/8032/769d0.png)
![\sigma =\sqrt{ \frac{[2 * [(54.5)^2) - 79.7^2 ]]+[313 *[ (64.5)^2)-79.7^2] +\cdots +[9 *[ (104.5)^2)- 79.7^2] }{2 + 313 +\cdots + 9}}](/tpl/images/0810/8032/2aaa3.png)
Another question on Mathematics
Mathematics, 21.06.2019 16:00
Whose conclusion is correct? choose all that apply. (two max) elijah emily edward esme
Answers: 2
Mathematics, 21.06.2019 20:20
Drag the tiles to the correct boxes to complete the pairs. not all tiles will be used. identify the domain for each of the given functions.
Answers: 1
You know the right answer?
The following data represent the high-temperature distribution for a summer month in a city for some...
Questions

Mathematics, 13.12.2019 13:31


History, 13.12.2019 13:31
History, 13.12.2019 13:31
English, 13.12.2019 13:31
English, 13.12.2019 13:31


Mathematics, 13.12.2019 13:31

Arts, 13.12.2019 13:31


