
A consultant's profit over the course of x years is shown in this scatter plot.
401
39
...

Mathematics, 16.10.2020 15:01 austinparness02
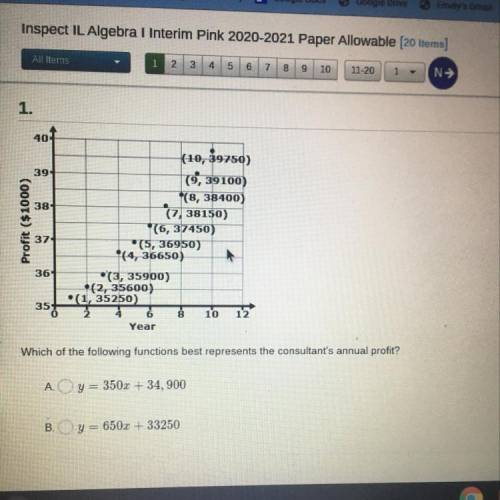
A consultant's profit over the course of x years is shown in this scatter plot.
401
39
381
Profit ($1000)
37-
(10, 39750)
19, 39100)
(8, 38400)
*(7,38150)
)
(6, 37450)
*(5, 36950)
*(4, 36650)
•(3, 35900)
•(2, 35600)
(1, 35250)
8
10 12
Year
361
35+
불
Which of the following functions best represents the consultant's annual profit?

Answers: 2
Another question on Mathematics
Mathematics, 21.06.2019 14:10
Drag the files to the correct boxes to complete the pairs. match each percent amount to its correct value 15% of 30 30% of 45 60% of 7 23% of 20 2019 edmentum. all nghts reserved
Answers: 1
Mathematics, 21.06.2019 20:30
Which inequality statement describes the two numbers on a number line? "? 7 and a number 5 units to the right of ? 7"
Answers: 2
Mathematics, 21.06.2019 23:30
Sally deposited money into a savings account paying 4% simple interest per year.the first year,she earned $75 in interest.how much interest will she earn during the following year?
Answers: 2
Mathematics, 22.06.2019 02:30
Atrain traveled for 1.5 hours to the first station, stopped for 30 minutes, then traveled for 4 hours to the final station where it stopped for 1 hour. the total distance traveled is a function of time. which graph most accurately represents this scenario? a graph is shown with the x-axis labeled time (in hours) and the y-axis labeled total distance (in miles). the line begins at the origin and moves upward for 1.5 hours. the line then continues upward at a slow rate until 2 hours. from 2 to 6 hours, the line continues quickly upward. from 6 to 7 hours, it moves downward until it touches the x-axis a graph is shown with the axis labeled time (in hours) and the y axis labeled total distance (in miles). a line is shown beginning at the origin. the line moves upward until 1.5 hours, then is a horizontal line until 2 hours. the line moves quickly upward again until 6 hours, and then is horizontal until 7 hours a graph is shown with the axis labeled time (in hours) and the y-axis labeled total distance (in miles). the line begins at the y-axis where y equals 125. it is horizontal until 1.5 hours, then moves downward until 2 hours where it touches the x-axis. the line moves upward until 6 hours and then moves downward until 7 hours where it touches the x-axis a graph is shown with the axis labeled time (in hours) and the y-axis labeled total distance (in miles). the line begins at y equals 125 and is horizontal for 1.5 hours. the line moves downward until 2 hours, then back up until 5.5 hours. the line is horizontal from 5.5 to 7 hours
Answers: 1
You know the right answer?
Questions

Mathematics, 29.09.2019 06:30


Social Studies, 29.09.2019 06:30
Mathematics, 29.09.2019 06:30
Social Studies, 29.09.2019 06:30

Mathematics, 29.09.2019 06:30
Mathematics, 29.09.2019 06:30

Computers and Technology, 29.09.2019 06:30

English, 29.09.2019 06:30

Geography, 29.09.2019 06:30
Social Studies, 29.09.2019 06:30
Mathematics, 29.09.2019 06:30


