
Mathematics, 17.10.2020 03:01 gmanbom
PLZZZ HELP ME OUT THIS DUE RIGHT NOW AND I FREAKING OUT PLEASE HELP ME OUT 61 POINTS WHO EVER HELPS ME PLZ HELP
The distance between point A and point B is 5.3. Give possible values for A and B in each situation
1.A and B are both positive numbers.
2. Either A or B is negative.
3.Both A and B are negative.
A. How are parts (a) and (c) similar to each other? How are they different from part (b)?
B. How is your strategy for part b different from parts (a) and (c)?
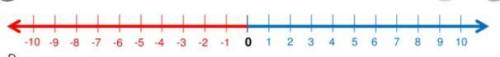
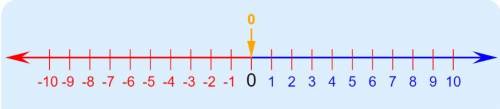
C. Point A is located at -4, and point B is 3 units from point A. Write two absolute value equation that could be used to determine the location of point B. Model this on the number line below.

Answers: 2
Another question on Mathematics
Mathematics, 21.06.2019 14:40
Two parallel lines are crossed by a transversal.what is value of x
Answers: 2
Mathematics, 21.06.2019 16:00
Part one: measurements 1. measure your own height and arm span (from finger-tip to finger-tip) in inches. you will likely need some from a parent, guardian, or sibling to get accurate measurements. record your measurements on the "data record" document. use the "data record" to you complete part two of this project. name relationship to student x height in inches y arm span in inches archie dad 72 72 ginelle mom 65 66 sarah sister 64 65 meleah sister 66 3/4 67 rachel sister 53 1/2 53 emily auntie 66 1/2 66 hannah myself 66 1/2 69 part two: representation of data with plots 1. using graphing software of your choice, create a scatter plot of your data. predict the line of best fit, and sketch it on your graph. part three: the line of best fit include your scatter plot and the answers to the following questions in your word processing document 1. 1. which variable did you plot on the x-axis, and which variable did you plot on the y-axis? explain why you assigned the variables in that way. 2. write the equation of the line of best fit using the slope-intercept formula $y = mx + b$. show all your work, including the points used to determine the slope and how the equation was determined. 3. what does the slope of the line represent within the context of your graph? what does the y-intercept represent? 5. use the line of best fit to you to describe the data correlation.
Answers: 2
Mathematics, 21.06.2019 21:50
Match each whole number with a rational, exponential expression 3 square root 27^2find the domain and range of the exponential function h(x)=125^x. explain your findings. as x decreases does h increase or decrease? explain. as x increases does h increase or decrease? explain.
Answers: 3
Mathematics, 21.06.2019 23:00
What unit of been sure would be appropriate for the volume of a sphere with a radius of 2 meters
Answers: 2
You know the right answer?
PLZZZ HELP ME OUT THIS DUE RIGHT NOW AND I FREAKING OUT PLEASE HELP ME OUT 61 POINTS WHO EVER HELPS...
Questions

Mathematics, 15.04.2020 04:58

Mathematics, 15.04.2020 04:58
Mathematics, 15.04.2020 04:58
Mathematics, 15.04.2020 04:58
Mathematics, 15.04.2020 04:58


Mathematics, 15.04.2020 04:58


