
Mathematics, 18.10.2020 08:01 chaaaa
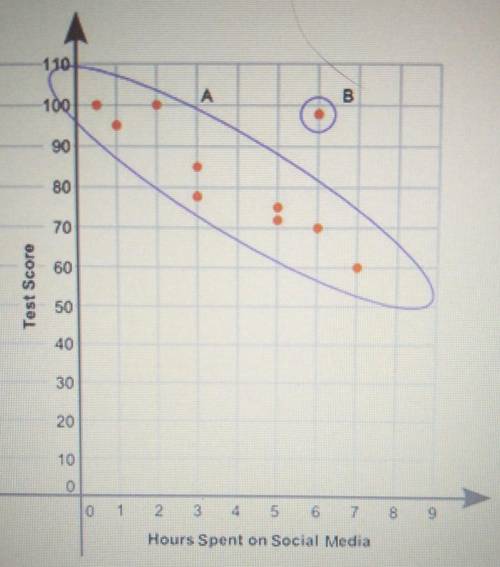
The scatter plot shows the relationship between the test scores of a group of students and the number of hours they spend on social media. What is the group of points labeled A is called? What is the point labeled B called? Give a possible answer for the presence of B.

Answers: 3
Another question on Mathematics
Mathematics, 21.06.2019 12:30
Select all the correct locations on the image. select all the expressions that result in a product that is a rational number. mulitiple choice4/3 x 12/3 32/4 x 15/4[tex]\sqrt{\frac{3}{2} }[/tex] x 22/7[tex]\sqrt{11}[/tex] x 2/3
Answers: 1
Mathematics, 21.06.2019 14:00
Use the knowledge of x- and y- intercepts to choose the correct graph of the equation 3x+6y=6
Answers: 1
Mathematics, 21.06.2019 16:30
Consider 6x2 + 6x + 1. which term immediately tells you that this expression is not a perfect square trinomial? justify your answer
Answers: 2
Mathematics, 21.06.2019 18:00
Write an equation for the function that includes the points (1,4/5) and (2,2/3)
Answers: 1
You know the right answer?
The scatter plot shows the relationship between the test scores of a group of students and the numbe...
Questions


Chemistry, 26.02.2021 17:20
Mathematics, 26.02.2021 17:20
Chemistry, 26.02.2021 17:20
Mathematics, 26.02.2021 17:20
Mathematics, 26.02.2021 17:20
Mathematics, 26.02.2021 17:20

Arts, 26.02.2021 17:20


English, 26.02.2021 17:20
English, 26.02.2021 17:20


