
Mathematics, 20.10.2020 01:01 darrengresham999
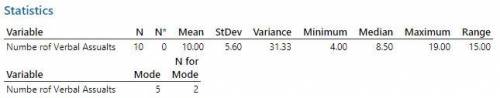
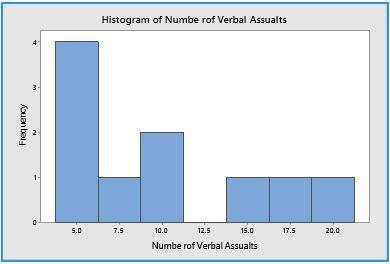
You come from a large, dysfunctional family. You learn of this year’s upcoming reunion, and dread the very thought of being around those people for any length of time. However, you’ve been intrigued by your introductory statistics course, and decide you will have some fun with the reunion by using it as an opportunity to study your family. As a preliminary project, you want to keep track of how many times each family member verbally assaults another person throughout the first 24 hours.
After 24 hours, you review your notes:
Family Member # Verbal Assaults
Stew (Dad) 5
Marge (Mom) 7
Betsy 18
Fred 11
Gracie 4
Jorge 10
Kim 5
Ferdinand 15
Hal 6
You 19
Find the mean, median, and mode of your distribution:
1. Mean
2. Median
3. Mode
4. Which measure of central tendency do you think is most appropriate for this dataser? Why?
5. What is the range of your dataset? Show how you figured it out.
6. Define, as specifically as necessary, the population in which you are interested for this research. In other words, how do you decide whether a person would be appropriate to include in your study?
7-9. Find the standard deviation for the data in the table on the first page. Showing your work is how you earn points for this part
10. What is the standard deviation of your dataset?

Answers: 1
Another question on Mathematics
Mathematics, 21.06.2019 14:10
What is the slope of the line that contains the points (4,8) and (9,8)? what type of line is it?
Answers: 2
Mathematics, 21.06.2019 16:00
In the 30-60-90 triangle below side s has a length of and side r has a length
Answers: 2
Mathematics, 21.06.2019 19:10
1jessica's home town is a mid-sized city experiencing a decline in population. the following graph models the estimated population if the decline continues at the same rate. select the most appropriate unit for the measure of time that the graph represents. a. years b. hours c. days d. weeks
Answers: 2
Mathematics, 21.06.2019 19:30
The revenue each season from tickets at the theme park is represented by t(c)=5x. the cost to pay the employees each season is represented by r(x)=(1.5)^x. examine the graph of the combined function for total profit and estimate the profit after four seasons
Answers: 3
You know the right answer?
You come from a large, dysfunctional family. You learn of this year’s upcoming reunion, and dread th...
Questions
Mathematics, 05.05.2020 12:17


Biology, 05.05.2020 12:17

History, 05.05.2020 12:17

Chemistry, 05.05.2020 12:17

Business, 05.05.2020 12:17
Mathematics, 05.05.2020 12:17
English, 05.05.2020 12:17
English, 05.05.2020 12:17
Mathematics, 05.05.2020 12:18
Chemistry, 05.05.2020 12:18
Mathematics, 05.05.2020 12:18
Mathematics, 05.05.2020 12:18
Mathematics, 05.05.2020 12:18

Social Studies, 05.05.2020 12:18
Biology, 05.05.2020 12:18


