
Mathematics, 01.11.2019 16:31 jay0630
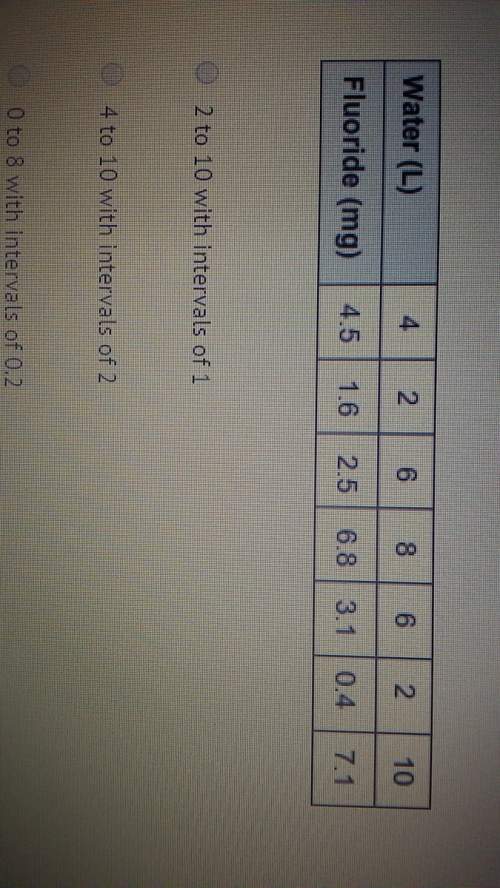
For making a scatter plot of the data set which would be the best scale and interval for the axis that represent the amount of fluorine?
a.2 to 10 with intervals of 1
b.4 to 10 with intervals of 2
c.0 to 8 with intervals of 0.2
d.0 to 8 with intervals of 4

Answers: 1
Another question on Mathematics
Mathematics, 21.06.2019 18:00
Since opening night, attendance at play a has increased steadily, while attendance at play b first rose and then fell. equations modeling the daily attendance y at each play are shown below, where x is the number of days since opening night. on what day(s) was the attendance the same at both plays? what was the attendance? play a: y = 8x + 191 play b: y = -x^2 + 26x + 126
Answers: 1
Mathematics, 22.06.2019 00:50
Problem 2. find the exact value of the remaining trigonometric functions. sketch theangle 8 for each problem. (3 points each)(a) tan 0 =o is in quadrant 2
Answers: 2
You know the right answer?
For making a scatter plot of the data set which would be the best scale and interval for the axis th...
Questions
Mathematics, 15.07.2020 02:01


History, 15.07.2020 02:01

Mathematics, 15.07.2020 02:01
Mathematics, 15.07.2020 02:01

Spanish, 15.07.2020 02:01


English, 15.07.2020 02:01
Mathematics, 15.07.2020 02:01


