
Mathematics, 20.10.2020 04:01 Alangs
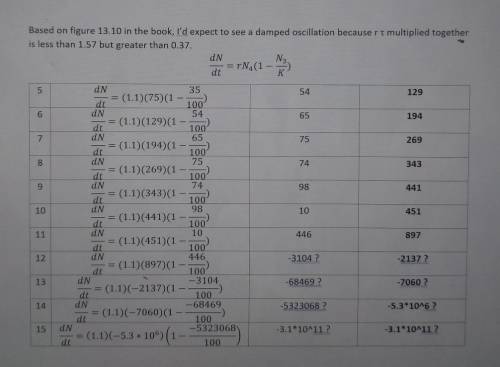
Using data provided, calculate the population size of the plant from year 5 through year 15. based on the product of rt, what type of oscillating behavior do you expect to see in the population even before doing the calculations? graph the results.
data provided:
K=100
t=1
r=1.1
=rN2(1-(N1/K))
There are 10 plants per square meter in year 1 and 20 plants in year 2. based on the data what is the expected change in population in year 3.
(1.1)(20)(1- (10/100) =20
20+20= 40 individuals in year 3
year 4: (1.1)(40)(1- (20/100) =35
35 + 40= 75 individuals
I solved this but I ended up getting negative numbers. I'm not sure what I did wrong or if I even did anything wrong. please help

Answers: 3
Another question on Mathematics
Mathematics, 21.06.2019 15:30
With: label the vertices and all the elements needed. find x
Answers: 2
Mathematics, 21.06.2019 19:30
Which of the following transformations will always produce a congruent figure?
Answers: 2
Mathematics, 21.06.2019 21:30
Af jewelry box is in the shape of a rectangular prism with an area of 528 cube inches. the length of the box is 12 inches and the height is 5 1/2 inches. what is the width of the jewelry box
Answers: 1
Mathematics, 21.06.2019 23:30
Kristen is wrapping presents for the holidays. she has a box that measures 4 ft. x 2 ft. x 2 ft. how many square feet of wrapping paper does she need to cover the box without overlapping?
Answers: 1
You know the right answer?
Using data provided, calculate the population size of the plant from year 5 through year 15. based o...
Questions
Mathematics, 26.06.2020 21:01


Mathematics, 26.06.2020 21:01
Mathematics, 26.06.2020 21:01


Mathematics, 26.06.2020 21:01


