
Mathematics, 20.10.2020 09:01 gabrielaperezcz
I. Collect data from several fast food chains on the number of fat calories and grams of saturated fat in menu items. Record at least 12 ordered pairs of (fat calories, grams of saturated fat). Organize your data in a table.
II. Make a scatter plot of the data on graph paper. Be sure to label the axes and use an appropriate title for the graph.
You may wish to use a graphing calculator, spread sheet, or other technology resource (such as the graphing utility link below) to aid you in graphing.
Create a Graph
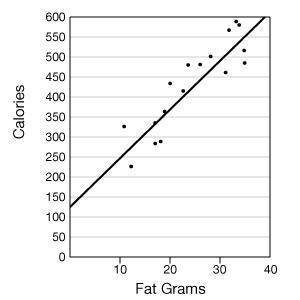
III. Draw a trend line for the scatter plot. Use the following scatter plot of the ordered pairs (fat grams, total calories) as an example.
IV. Calculate the slope of the trend line. (Choose two points on the line and find vertical change over horizontal change.)
Note: Graphing calculators and spread sheets have features with which to draw trend lines and determine the equation. You may choose to use one of these options. If you use technology, indicate what steps were taken to arrive at your equation.
V. Using the slope and y-intercept, write the equation of the trend line ( y = mx + b).
VI. Choose a "calories from fat" value that is not in your collected data set and that is at least 10 fat calories away from any collected value. Use the equation calculated in step V to predict the number of fat grams in an item having that number of fat calories. Be sure to show your work.
VII. Search for an item in a fast food menu having the same number of fat calories as the one you chose above. (If you cannot find the exact value, get as close as you can.) Compare the calculated value from step VI to this actual value. Explain why (or why not) you would have expected your prediction (calculated value) to be close to the actual value.

Answers: 3
Another question on Mathematics
Mathematics, 21.06.2019 13:00
Sal is tiling his entryway. the floor plan is drawn on a unit grid. each unit length represents 1 foot. tile costs $1.35 per square foot. how much will sal pay to tile his entryway? round your answer to the nearest cent.
Answers: 2
Mathematics, 21.06.2019 16:30
For how answer my question this will be the last question can you answer in math subject
Answers: 2
Mathematics, 21.06.2019 19:40
The owners of four companies competing for a contract are shown in the table below. if a report is released that advocates company b, which of the people having funded the report should result in the most skepticism? company owner of company company a jake adams company b company c company d debby smith henry rose rhonda baker o a. jake adams o b. rhonda baker o c. debby smith o d. henry rose
Answers: 2
Mathematics, 21.06.2019 23:30
The bottom of ignacio's desktop is 74.5cm from the floor. ignacios sits in his adjustable chair, and the tops of his legs are 49.3cm from the floor. each clockwise rotation of the knob on the chair raises ignacio's legs by 4.8cm. write an inequality to determine the number of clockwise rotations, r, ignacio could make with the knob without his legs touching the desk.
Answers: 3
You know the right answer?
I. Collect data from several fast food chains on the number of fat calories and grams of saturated f...
Questions


Mathematics, 23.08.2020 01:01


Health, 23.08.2020 01:01
Engineering, 23.08.2020 01:01


Law, 23.08.2020 01:01
English, 23.08.2020 01:01
Mathematics, 23.08.2020 01:01

Computers and Technology, 23.08.2020 01:01
Computers and Technology, 23.08.2020 01:01


