
Mathematics, 21.10.2020 23:01 jordan7626
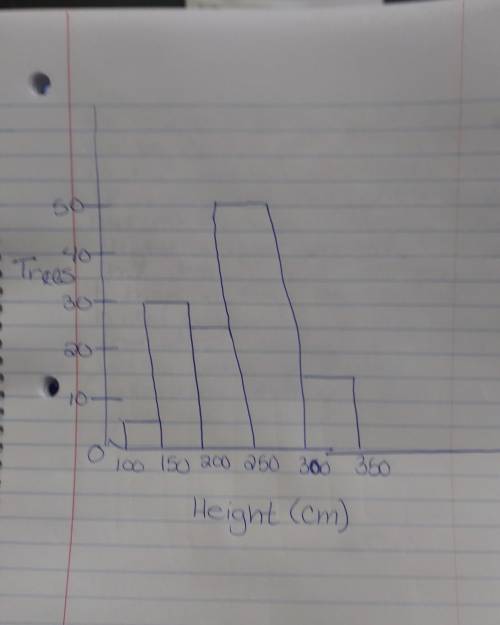
the histogram to the right displays the height of 122 trees and Mr. Maciag's subdivision. He is very excited about autumn and the leaves changing colors. Height ranged between 108 cm and 345 cm. Let the function "f" map a tree height to the frequency of the column that tree belongs to. What is the value of f(250)? Explain the steps you followed to find the value.

Answers: 3
Another question on Mathematics
Mathematics, 21.06.2019 22:30
Solve: 25 points find the fifth term of an increasing geometric progression if the first term is equal to 7−3 √5 and each term (starting with the second) is equal to the difference of the term following it and the term preceding it.
Answers: 1
Mathematics, 22.06.2019 01:00
Ineed to know how to write question one in mathematical terms
Answers: 1
You know the right answer?
the histogram to the right displays the height of 122 trees and Mr. Maciag's subdivision. He is very...
Questions


Medicine, 10.10.2019 20:10

German, 10.10.2019 20:10
Mathematics, 10.10.2019 20:10

Medicine, 10.10.2019 20:10
Mathematics, 10.10.2019 20:10


