
Mathematics, 22.10.2020 16:01 marahsenno
The histogram shows the distribution of hurricanes that have hit a country from 1851 through 2015, where 1 is the weakest level and 5 is the strongest level.
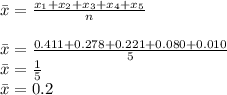
1= 0.411
2=0.278
3=0.221
4=0.080
5=0.010
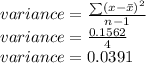
(a) Find the mean, variance and standard deviation of the probability distribution.
(b) Interpret the results: A, B, C or D.
A. The average hurricane is aprox. category 1.
B. The average hurricane is aprox. category 2.*
C. Most of the hurricane sizes differ from the average by about 2 or 3.
D. Most of the hurricane sized differ from the average by about 1 or 2.*

Answers: 3
 )
)


Another question on Mathematics
Mathematics, 21.06.2019 18:30
Factor k2 - 17k + 16. a.(k - 2)(k - 8) b.(k - 1)(k + 16) c.(k - 1)(k - 16)
Answers: 1
Mathematics, 21.06.2019 21:00
Julie buys 2kg of apples and 7kg of pears ? 12.70. the pears cost ? 1.30 per kilogram what is the price per kilogram of the apples? show your working out
Answers: 2
Mathematics, 21.06.2019 21:10
If f(x) and g(x) are inverse functions of each other, which of the following shows the graph of f(g(x)
Answers: 1
Mathematics, 21.06.2019 22:10
Using graph paper, determine the line described by the given point and slope. click to show the correct graph below.(0, 0) and 2/3
Answers: 2
You know the right answer?
The histogram shows the distribution of hurricanes that have hit a country from 1851 through 2015, w...
Questions
Mathematics, 10.12.2021 08:00

Social Studies, 10.12.2021 08:00
Mathematics, 10.12.2021 08:00
Mathematics, 10.12.2021 08:00


English, 10.12.2021 08:00
English, 10.12.2021 08:00
Mathematics, 10.12.2021 08:10

Mathematics, 10.12.2021 08:10

Geography, 10.12.2021 08:10
Mathematics, 10.12.2021 08:10


