
Mathematics, 23.10.2020 19:50 heysonic91
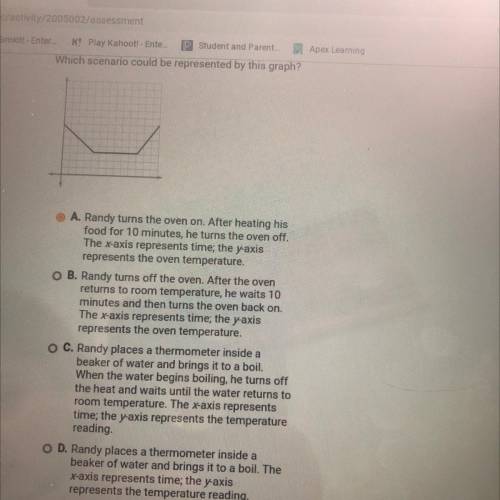
Which scenario could be represented by this graph?
O A. Randy turns the oven on. After heating his
food for 10 minutes, he turns the oven off.
The xaxis represents time; the yaxis
represents the oven temperature
O B. Randy turns off the oven. After the oven
returns to room temperature, he waits 10
minutes and then turns the oven back on.
The x-axis represents time; the yaxis
represents the oven temperature.
O C. Randy places a thermometer inside a
beaker of water and brings it to a boil.
When the water begins boiling, he turns off
the heat and waits until the water returns to
room temperature. The axis represents
time, the yaxis represents the temperature
reading
O D. Randy places a thermometer inside a
beaker of water and brings it to a boil. The
xaxis represents time; the y-axis
represents the temperature reading
APEX plz help I need tons of help if u don’t mind:(
I give extra points

Answers: 3
Another question on Mathematics
Mathematics, 21.06.2019 17:00
The magnitude, m, of an earthquake is defined to be m=log l/s, where i is the intensity of the earthquake (measured by the amplitude of the seismograph wave) and s is the intensity of a “standard” earthquake, which is barely detectable. what is the magnitude of an earthquake that is 1,000 times more intense than a standard earthquake? use a calculator. round your answer to the nearest tenth.
Answers: 1
Mathematics, 21.06.2019 20:30
If there is 20 dogs in the shelter and 5 dogs get homes, and then 43 more dogs come. how many dogs are there in the shelter?
Answers: 1
Mathematics, 22.06.2019 02:30
Which statement best explains whether the table represents a linear or nonlinear function? input (x) output (y) 2 5 4 10 6 15 8 20 it is a linear function because the input values are increasing. it is a nonlinear function because the output values are increasing. it is a linear function because there is a constant rate of change in both the input and output. it is a nonlinear function because there is a constant rate of change in both the input and output.
Answers: 3
You know the right answer?
Which scenario could be represented by this graph?
O A. Randy turns the oven on. After heating his<...
Questions
Mathematics, 13.07.2019 14:50


History, 13.07.2019 14:50


Chemistry, 13.07.2019 14:50

Spanish, 13.07.2019 14:50
Mathematics, 13.07.2019 14:50
Biology, 13.07.2019 14:50
Mathematics, 13.07.2019 14:50

Social Studies, 13.07.2019 14:50
Social Studies, 13.07.2019 14:50


